Rosetta Stone 2009 Annual Report Download - page 61
Download and view the complete annual report
Please find page 61 of the 2009 Rosetta Stone annual report below. You can navigate through the pages in the report by either clicking on the pages listed below, or by using the keyword search tool below to find specific information within the annual report.-
 1
1 -
2
-
3
-
4
-
5
-
6
-
7
-
8
-
9
-
10
-
11
-
12
-
13
-
14
-
15
-
16
-
17
-
18
-
19
-
20
-
21
-
22
-
23
-
24
-
25
-
26
-
27
-
28
-
29
-
30
-
31
-
32
-
33
-
34
-
35
-
36
-
37
-
38
-
39
-
40
-
41
-
42
-
43
-
44
-
45
-
46
-
47
-
48
-
49
-
50
-
 51
51 -
 52
52 -
 53
53 -
 54
54 -
 55
55 -
 56
56 -
 57
57 -
 58
58 -
 59
59 -
 60
60 -
 61
61 -
 62
62 -
 63
63 -
 64
64 -
 65
65 -
 66
66 -
 67
67 -
 68
68 -
 69
69 -
 70
70 -
 71
71 -
72
-
73
-
74
-
75
-
76
-
77
-
78
-
79
-
80
-
81
-
82
-
83
-
84
-
85
-
86
-
87
-
88
-
89
-
90
-
91
-
92
-
93
-
94
-
95
-
96
-
97
-
98
-
99
-
100
-
101
-
102
-
103
-
104
-
105
-
106
-
107
-
108
-
109
-
110
-
111
-
112
-
113
-
114
-
115
-
116
-
117
-
118
-
119
-
120
-
121
-
122
-
123
-
124
-
125
-
126
-
127
-
128
 |
 |

Table of Contents
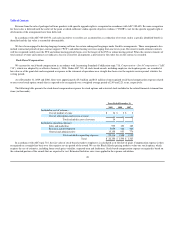
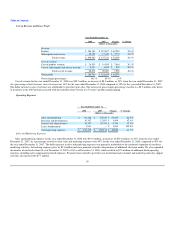
Consumer
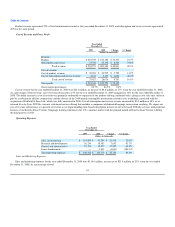
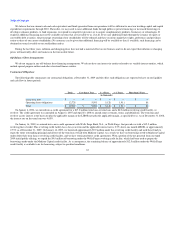
Consumer revenue was $167.7 million for the year ended December 31, 2008, an increase of $60.6 million, or 57%, from the year ended December 31,
2007. The increase in consumer revenue was attributable to a 22% increase in unit sales, which resulted in a $23.7 million increase in revenue, combined with
a 28% increase in the average selling price of each unit, which accounted for a $36.9 million increase in revenue. Unit growth was driven by the expansion of
our direct advertising campaign as well as growth in our retail distribution network. Direct advertising expenses increased 38% to $33.9 million during the
year ended December 31, 2008, while the number of kiosks increased from 86 to 150 from December 31, 2007 to December 31, 2008. We also received a
$2.6 million initial stocking order from Barnes & Noble in June 2008 to support their expansion of our product line to over 650 of their stores nationally.
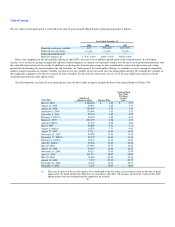
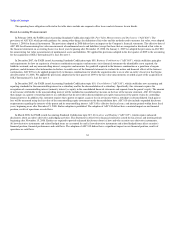
In August 2007, we released our Version 3 solution for ten of our best selling languages. All Version 3 solutions include three course levels, while our
Version 2 solutions only include one or two course levels. Upon the release of a language in Version 3, we discontinue selling that language in Version 2 and,
as a result, sales of Version 3 products replace sales of Version 2 products for that language. Our solutions are often purchased in sets including all available
course levels for a language. The additional levels included in Version 3 enabled us to offer additional languages with three course levels, resulting in a
greater number of available products at our highest price point for a complete set. In March 2008, we released Version 3 in four additional languages and, in
June 2008, we released seven additional Version 3 languages. Also in June 2008, we released our Audio Companion practice tool product for all 14 then-
available Version 3 languages. In September 2008, we released Version 3 and our Audio Companion in seven additional languages. This expansion of our
product portfolio with higher price point options has resulted in the 28% increase in average selling price per unit for the year ended December 31, 2008.
Product revenue represented 94% of total consumer revenue for the year ended December 31, 2008, with the balance attributable to subscription and
service revenue.
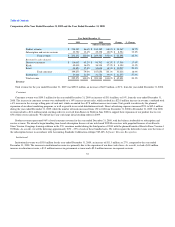
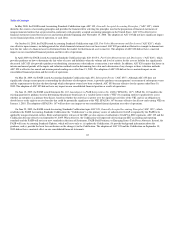
Institutional
Institutional revenue was $41.7 million for the year ended December 31, 2008, an increase of $11.5 million, or 38%, compared to the year ended
December 31, 2007. The increase in institutional revenue was primarily due to the expansion of our direct sales force. As a result, we had a $9.4 million
increase in education and home school revenue and a $1.6 million increase in corporate revenue.
Product revenue represented 65% of total institutional revenue for the year ended December 31, 2008, and subscription and service revenue represented
35% for the same period.
58