Rosetta Stone 2009 Annual Report Download - page 60
Download and view the complete annual report
Please find page 60 of the 2009 Rosetta Stone annual report below. You can navigate through the pages in the report by either clicking on the pages listed below, or by using the keyword search tool below to find specific information within the annual report.-
 1
1 -
2
-
3
-
4
-
5
-
6
-
7
-
8
-
9
-
10
-
11
-
12
-
13
-
14
-
15
-
16
-
17
-
18
-
19
-
20
-
21
-
22
-
23
-
24
-
25
-
26
-
27
-
28
-
29
-
30
-
31
-
32
-
33
-
34
-
35
-
36
-
37
-
38
-
39
-
40
-
41
-
42
-
43
-
44
-
45
-
46
-
47
-
48
-
49
-
 50
50 -
 51
51 -
 52
52 -
 53
53 -
 54
54 -
 55
55 -
 56
56 -
 57
57 -
 58
58 -
 59
59 -
 60
60 -
 61
61 -
 62
62 -
 63
63 -
 64
64 -
 65
65 -
 66
66 -
 67
67 -
 68
68 -
 69
69 -
 70
70 -
71
-
72
-
73
-
74
-
75
-
76
-
77
-
78
-
79
-
80
-
81
-
82
-
83
-
84
-
85
-
86
-
87
-
88
-
89
-
90
-
91
-
92
-
93
-
94
-
95
-
96
-
97
-
98
-
99
-
100
-
101
-
102
-
103
-
104
-
105
-
106
-
107
-
108
-
109
-
110
-
111
-
112
-
113
-
114
-
115
-
116
-
117
-
118
-
119
-
120
-
121
-
122
-
123
-
124
-
125
-
126
-
127
-
128
 |
 |

Table of Contents
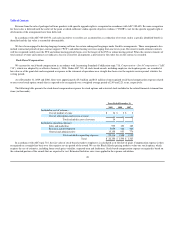
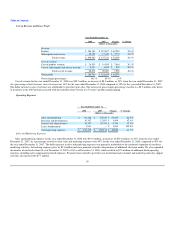
Income Tax Expense
Year Ended
December 31,
2009 2008 Change % Change
(dollars in thousands)
Income tax expense $ 7,084 $ 13,435 $ (6,351) (47.3)%
Income tax expense for the year ended December 31, 2009 was $7.1 million, a decrease of $6.4 million, or 47%, compared to the year ended
December 31, 2008. The decrease was the result of a decrease of $6.9 million in pre-tax income for the year ended December 31, 2009 and a lower effective
tax rate, compared to the year ended December 31, 2008. Our effective tax rate decreased to 35% for the year ended December 31, 2009 compared to 49% for
the year ended December 31, 2008. The reduction in our effective tax rate was a result of changes in the geographic distribution of our income and a change
in our transfer pricing agreements.
We determine the pricing among our associated entities on the basis of detailed functional and economic analysis involving benchmarking against
transactions among entities that are not under common control. Based on our analysis, we made changes to the transfer pricing agreements effective
January 1, 2009. The resulting change in geographic distributions of income contributed to a lower effective tax rate as compared to the year ended
December 31, 2008.
We do not currently record income tax on the results of our U.K., Japan or German subsidiaries. Despite enacting certain tax planning strategies during
the year ended December 31, 2009, no subsidiary has produced sustainable pretax profits as of December 31, 2009 and each remains in a three-year
cumulative loss position. Accordingly we continue to carry a full valuation allowance on net operating loss carryforwards and other deferred tax assets for
these jurisdictions. As we continue operations in accordance with the revised transfer pricing agreements, we will monitor actual results and updated
projections on a quarterly basis. When and if the subsidiaries realize or realistically anticipate sustainable profitability, we will assess the appropriateness of
releasing the valuation allowance in whole or in part.
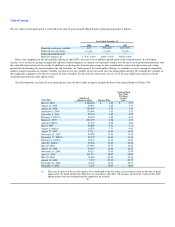
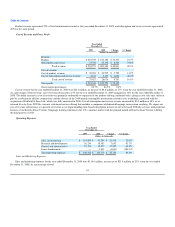
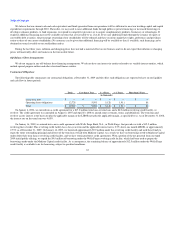
Comparison of the Year Ended December 31, 2008 and the Year Ended December 31, 2007
Year Ended December 31,
2008 2007 Change % Change
(dollars in thousands)
Product revenue $ 184,182 88.0% $ 119,897 87.3% $ 64,285 53.6%
Subscription and service revenue 25,198 12.0% 17,424 12.7% $ 7,774 44.6%
Total revenue $ 209,380 100.0% $ 137,321 100.0% $ 72,059 52.5%
Revenue by sales channel:
Direct-to-consumer $ 96,702 46.2% $ 61,950 45.1% $ 34,752 56.1%
Kiosk 36,314 17.3% 23,947 17.4% $ 12,367 51.6%
Retail 34,638 16.5% 21,206 15.4% $ 13,432 63.3%
Total consumer 167,654 80.1% 107,103 78.0% 60,551 56.5%
Institutional 41,726 19.9% 30,218 22.0% $ 11,508 38.1%
Total revenue $ 209,380 100.0% $ 137,321 100.0% $ 72,059 52.5%
Revenue
Total revenue for the year ended December 31, 2008 was $209.4 million, an increase of $72.1 million, or 53%, from the year ended December 31, 2007.
57