Rosetta Stone 2009 Annual Report Download - page 58
Download and view the complete annual report
Please find page 58 of the 2009 Rosetta Stone annual report below. You can navigate through the pages in the report by either clicking on the pages listed below, or by using the keyword search tool below to find specific information within the annual report.-
 1
1 -
2
-
3
-
4
-
5
-
6
-
7
-
8
-
9
-
10
-
11
-
12
-
13
-
14
-
15
-
16
-
17
-
18
-
19
-
20
-
21
-
22
-
23
-
24
-
25
-
26
-
27
-
28
-
29
-
30
-
31
-
32
-
33
-
34
-
35
-
36
-
37
-
38
-
39
-
40
-
41
-
42
-
43
-
44
-
45
-
46
-
47
-
 48
48 -
 49
49 -
 50
50 -
 51
51 -
 52
52 -
 53
53 -
 54
54 -
 55
55 -
 56
56 -
 57
57 -
 58
58 -
 59
59 -
 60
60 -
 61
61 -
 62
62 -
 63
63 -
 64
64 -
 65
65 -
 66
66 -
 67
67 -
 68
68 -
69
-
70
-
71
-
72
-
73
-
74
-
75
-
76
-
77
-
78
-
79
-
80
-
81
-
82
-
83
-
84
-
85
-
86
-
87
-
88
-
89
-
90
-
91
-
92
-
93
-
94
-
95
-
96
-
97
-
98
-
99
-
100
-
101
-
102
-
103
-
104
-
105
-
106
-
107
-
108
-
109
-
110
-
111
-
112
-
113
-
114
-
115
-
116
-
117
-
118
-
119
-
120
-
121
-
122
-
123
-
124
-
125
-
126
-
127
-
128
 |
 |

Table of Contents
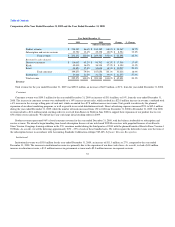
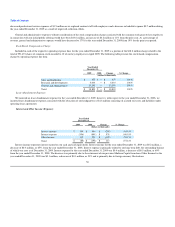
revenue, sales and marketing expenses were 46% for the year ended December 31, 2009, compared to 45% for the year ended December 31, 2008. The dollar
and percentage increase in sales and marketing expenses were primarily attributable to the continued expansion of our direct marketing activities. Advertising
expenses grew by $8.6 million and were primarily related to television and radio media and internet marketing. We also expanded the number of our kiosks
from 150 as of December 31, 2008 to 242 as of December 31, 2009, which resulted in $6.2 million of additional kiosk operating expenses, including rent and
sales compensation related expenses. Personnel costs related to growth in our institutional sales channel and marketing and sales support activities also
increased by $6.4 million. The stock compensation charge related to a common stock grant to key employees in connection with our initial public offering
resulted in a $0.4 million increase in sales and marketing expense in 2009 compared to the prior year period. Completion in January 2009 of the amortization
of the intangible assets associated with the 2006 acquisition of Fairfield & Sons, Ltd. resulted in a $3.0 million reduction in amortization expense in 2009
when compared to the prior year period.
Sales and marketing expenses without consideration of the stock compensation charge associated with the common stock grant to key employees in
connection with our initial public offering would have been $114.5 million, an increase of $21.1 million or 23% from the prior year. As a percentage of
revenue, sales and marketing expenses would have remained the same at 45% for the year ended December 31, 2009 compared to the prior year period.
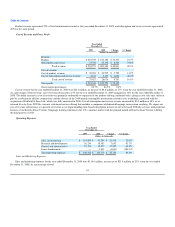
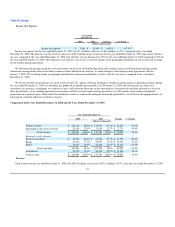
Research and Development Expenses
Research and development expenses were $26.2 million for the year ended December 31 2009, an increase of $7.9 million, or 43%, from the year ended
December 31, 2008. As a percentage of total revenue, research and development expenses increased to 10% for the year ended December 31, 2009 compared
to 9% for the year ended December 31, 2008. The dollar and percentage increase were primarily attributable to a stock compensation charge related to
common stock awarded to key employees which resulted in a $5.0 million increase in research and development expense in 2009 when compared to the prior
year period. In addition, research and development expenses increased $3.0 million due to the addition of new product development personnel associated with
the development of new products and services that are complementary to our existing solutions.
Research and development expenses without consideration of the stock compensation charge associated with the common stock grant to key employees
in connection with our initial public offering would have been $21.2 million, an increase of $2.9 million or 16% from the prior year. As a percentage of
revenue, research and development expenses would have decreased to 8% for the year ended December 31, 2009 from 9% for the prior year period.
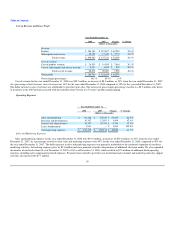
General and Administrative Expenses
General and administrative expenses for the year ended December 31, 2009 were $57.2 million, an increase of $17.6 million, or 45%, from the year
ended December 31, 2008. As a percentage of revenue, general and administrative expenses increased to 23% for the year ended December 31, 2009
compared to 19% for the year ended December 31, 2008. The dollar and percentage increase was primarily attributable to a stock compensation charge related
to common stock awarded to key employees in connection with our initial public offering resulting in a $13.4 million increase in general and administrative
expense. In addition, general and administrative expenses increased due to greater personnel related costs as we expanded our finance, legal, information
technology and other administrative functions to support the overall growth in our business. Personnel-related costs increased $4.2 million with a
corresponding increase in communications, training, recruitment, travel and other support costs of $0.6 million and new office space and equipment
depreciation costs of $0.9 million. Legal fees also increased $0.4 million related to intellectual property protection matters, and liability insurances for
directors and officers increased $0.3 million. This increase was partially offset by
55