Rosetta Stone 2009 Annual Report Download - page 65
Download and view the complete annual report
Please find page 65 of the 2009 Rosetta Stone annual report below. You can navigate through the pages in the report by either clicking on the pages listed below, or by using the keyword search tool below to find specific information within the annual report.-
 1
1 -
2
-
3
-
4
-
5
-
6
-
7
-
8
-
9
-
10
-
11
-
12
-
13
-
14
-
15
-
16
-
17
-
18
-
19
-
20
-
21
-
22
-
23
-
24
-
25
-
26
-
27
-
28
-
29
-
30
-
31
-
32
-
33
-
34
-
35
-
36
-
37
-
38
-
39
-
40
-
41
-
42
-
43
-
44
-
45
-
46
-
47
-
48
-
49
-
50
-
51
-
52
-
53
-
54
-
 55
55 -
 56
56 -
 57
57 -
 58
58 -
 59
59 -
 60
60 -
 61
61 -
 62
62 -
 63
63 -
 64
64 -
 65
65 -
 66
66 -
 67
67 -
 68
68 -
 69
69 -
 70
70 -
 71
71 -
 72
72 -
 73
73 -
 74
74 -
 75
75 -
76
-
77
-
78
-
79
-
80
-
81
-
82
-
83
-
84
-
85
-
86
-
87
-
88
-
89
-
90
-
91
-
92
-
93
-
94
-
95
-
96
-
97
-
98
-
99
-
100
-
101
-
102
-
103
-
104
-
105
-
106
-
107
-
108
-
109
-
110
-
111
-
112
-
113
-
114
-
115
-
116
-
117
-
118
-
119
-
120
-
121
-
122
-
123
-
124
-
125
-
126
-
127
-
128
 |
 |

Table of Contents
Cash Flow Analysis
Net Cash Provided By Operating Activities
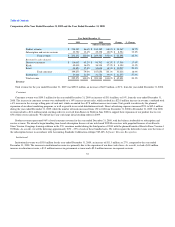
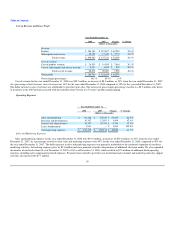
Net cash provided by operating activities was $41.2 million for the year ended December 31, 2009. Net cash provided by operating activities was
primarily generated from net income as adjusted for depreciation and amortization and stock compensation expense. Net income totaled $13.4 million for the
year ended December 31, 2009. Depreciation, amortization and stock compensation expense for the period totaled $27.6 million. A decrease in amortization
resulting from the full amortization of intangible assets in January 2009 was partially offset by increases in depreciation on tangible assets associated with the
expansion of the business. The increase in stock-based compensation expense was primarily the result of $18.5 million in expense associated with the
issuance of common stock to key employees in April 2009. Additionally, a $10.3 million increase in deferred revenue resulting from greater sales of
subscription licenses contributed to net cash provided by operations.
Net cash provided by operating activities was $18.3 million for the year ended December 31, 2008. Net cash provided by operating activities was
primarily generated from net income as adjusted for depreciation and amortization and stock compensation expense. Net income totaled $13.9 million for the
year ended December 31, 2008. Depreciation, amortization and stock compensation expense for the period totaled $8.7 million. Increases in deferred revenue
resulting from greater sales of subscription licenses also contributed to net cash provided by operations; the increase represented $3.1 million for the year
ended December 31, 2008. As a result of the growth in our retail channel and institutional sales, accounts receivable increased by $16.5 million. This increase
in accounts receivable was offset in part by increases in net liabilities associated with the expansion of our business.
Net cash provided by operating activities was $15.8 million for the year ended December 31, 2007. Net cash provided by operating activities was
primarily generated from net income as adjusted for depreciation and amortization and stock compensation expense. Net income totaled $2.6 million for the
year ended December 31, 2007. Depreciation and amortization and stock compensation expense for the period aggregated to $9.1 million. Increases in
deferred revenue resulting from greater sales of subscription licenses also contributed to net cash provided by operations; the increase represented $4.8 million
for the year ended December 31, 2007. As a result of the growth in our business, we had increases in accounts receivable and inventory, offset in part by
increases in net liabilities.
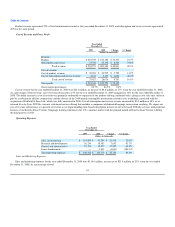
Net Cash Used In Investing Activities
Net cash used in investing activities was $8.6 million, $7.0 million, and $9.2 million for the years ended December 31, 2009, 2008 and 2007,
respectively. Our investing activities during these periods primarily related to the purchase of property and equipment associated with the expansion of our
information technology systems and our facilities as a result of our growth.
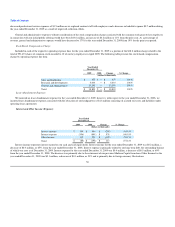
Net Cash Used In Financing Activities
Net cash provided by financing activities was $32.0 million for the year ended December 31, 2009 primarily related to $49.0 million in net proceeds
from our initial public offering, offset by the $9.9 million payment of the balance outstanding under our revolving credit facility with Wells Fargo and the
$7.9 million payment of taxes associated with the common stock grant to some of our key employees.
Net cash used in financing activities was $4.6 million and $1.8 million for the years ended December 31, 2008 and 2007, respectively. Net cash used in
financing activities during these periods was primarily related to principal payments on our long-term debt. Additionally, for the year ended December 31,
2008, net cash used in financing activities also included payments associated with our planned initial public offering.
62