Rosetta Stone 2009 Annual Report Download - page 55
Download and view the complete annual report
Please find page 55 of the 2009 Rosetta Stone annual report below. You can navigate through the pages in the report by either clicking on the pages listed below, or by using the keyword search tool below to find specific information within the annual report.-
 1
1 -
2
-
3
-
4
-
5
-
6
-
7
-
8
-
9
-
10
-
11
-
12
-
13
-
14
-
15
-
16
-
17
-
18
-
19
-
20
-
21
-
22
-
23
-
24
-
25
-
26
-
27
-
28
-
29
-
30
-
31
-
32
-
33
-
34
-
35
-
36
-
37
-
38
-
39
-
40
-
41
-
42
-
43
-
44
-
 45
45 -
 46
46 -
 47
47 -
 48
48 -
 49
49 -
 50
50 -
 51
51 -
 52
52 -
 53
53 -
 54
54 -
 55
55 -
 56
56 -
 57
57 -
 58
58 -
 59
59 -
 60
60 -
 61
61 -
 62
62 -
 63
63 -
 64
64 -
 65
65 -
66
-
67
-
68
-
69
-
70
-
71
-
72
-
73
-
74
-
75
-
76
-
77
-
78
-
79
-
80
-
81
-
82
-
83
-
84
-
85
-
86
-
87
-
88
-
89
-
90
-
91
-
92
-
93
-
94
-
95
-
96
-
97
-
98
-
99
-
100
-
101
-
102
-
103
-
104
-
105
-
106
-
107
-
108
-
109
-
110
-
111
-
112
-
113
-
114
-
115
-
116
-
117
-
118
-
119
-
120
-
121
-
122
-
123
-
124
-
125
-
126
-
127
-
128
 |
 |

Table of Contents
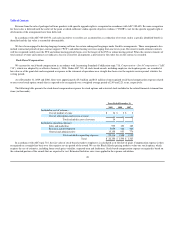
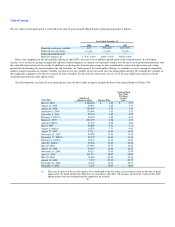
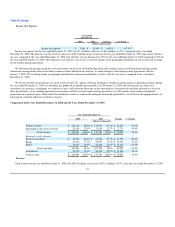
Results of Operations
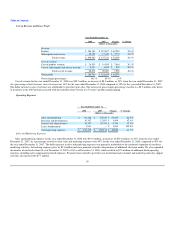
The following table sets forth our consolidated statement of operations for the periods indicated.
Year Ended December 31,
2009 2008 2007
(in thousands, except per share data)
Statements of Operations Data:
Revenue $ 252,271 $ 209,380 $ 137,321
Cost of revenue 33,427 28,676 20,687
Gross profit 218,844 180,704 116,634
Operating expenses:
Sales and marketing 114,899 93,384 65,437
Research and development 26,239 18,387 12,893
General and administrative 57,174 39,577 29,786
Lease abandonment — 1,831 —
Total operating expenses 198,312 153,179 108,116
Income from operations 20,532 27,525 8,518
Other income and expense:
Interest income 159 454 673
Interest expense (356) (891) (1,331)
Other (expense) income 112 239 154
Interest and other income (expense), net (85) (198) (504)
Income before income taxes 20,447 27,327 8,014
Income tax expense (benefit) 7,084 13,435 5,435
Net income 13,363 13,892 2,579
Preferred stock accretion — — (80)
Income attributable to common stockholders $ 13,363 $ 13,892 $ 2,499
Income per share attributable to common stockholders:
Basic $ 0.89 $ 7.29 $ 1.47
Diluted $ 0.67 $ 0.82 $ 0.15
Common shares and equivalents outstanding:
Basic weighted average shares 14,990 1,905 1,702
Diluted weighted average shares 19,930 16,924 16,533
Stock-based compensation included in:
Cost of sales $ 34 $ 2 $ 2
Sales and marketing 999 153 189
Research and development 5,959 482 360
General and administrative 15,158 953 776
Transaction-related expenses — — —
$ 22,150 $ 1,590 $ 1,327
Intangible amortization included in:
Cost of sales $ — $ 13 $ 1,227
Sales and marketing 42 3,003 3,596
$ 42 $ 3,016 $ 4,823
52