Rosetta Stone 2009 Annual Report Download - page 43
Download and view the complete annual report
Please find page 43 of the 2009 Rosetta Stone annual report below. You can navigate through the pages in the report by either clicking on the pages listed below, or by using the keyword search tool below to find specific information within the annual report.-
 1
1 -
2
-
3
-
4
-
5
-
6
-
7
-
8
-
9
-
10
-
11
-
12
-
13
-
14
-
15
-
16
-
17
-
18
-
19
-
20
-
21
-
22
-
23
-
24
-
25
-
26
-
27
-
28
-
29
-
30
-
31
-
32
-
 33
33 -
 34
34 -
 35
35 -
 36
36 -
 37
37 -
 38
38 -
 39
39 -
 40
40 -
 41
41 -
 42
42 -
 43
43 -
 44
44 -
 45
45 -
 46
46 -
 47
47 -
 48
48 -
 49
49 -
 50
50 -
 51
51 -
 52
52 -
 53
53 -
54
-
55
-
56
-
57
-
58
-
59
-
60
-
61
-
62
-
63
-
64
-
65
-
66
-
67
-
68
-
69
-
70
-
71
-
72
-
73
-
74
-
75
-
76
-
77
-
78
-
79
-
80
-
81
-
82
-
83
-
84
-
85
-
86
-
87
-
88
-
89
-
90
-
91
-
92
-
93
-
94
-
95
-
96
-
97
-
98
-
99
-
100
-
101
-
102
-
103
-
104
-
105
-
106
-
107
-
108
-
109
-
110
-
111
-
112
-
113
-
114
-
115
-
116
-
117
-
118
-
119
-
120
-
121
-
122
-
123
-
124
-
125
-
126
-
127
-
128
 |
 |

Table of Contents
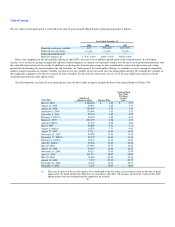
Item 6. Selected Consolidated Financial Data
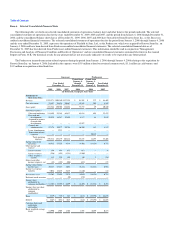
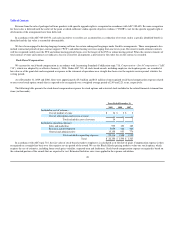
The following table sets forth our selected consolidated statement of operations, balance sheet and other data for the periods indicated. The selected
consolidated statement of operations data for the years ended December 31, 2009, 2008 and 2007, and the period from January 4, 2006 through December 31,
2006, and the consolidated balance sheet data as of December 31, 2009, 2008, 2007 and 2006 have been derived from Rosetta Stone Inc., or the Successor,
audited consolidated financial statements. The selected consolidated statement of operations data for the period from January 1, 2006 through January 4, 2006
and the year ended December 31, 2005, represents the operations of Fairfield & Sons, Ltd., or the Predecessor, which was acquired by Rosetta Stone Inc. on
January 4, 2006 and have been derived from Predecessor audited consolidated financial statements. The selected consolidated financial data as of
December 31, 2005 has been derived from Predecessor audited financial statements. This information should be read in conjunction "Management's
Discussion and Analysis of Financial Condition and Results of Operations" and our consolidated financial statements contained elsewhere in this Annual
Report on Form 10-K. Our historical results for any prior period are not necessarily indicative of results to be expected in any future period.
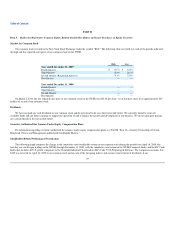
The Predecessor incurred transaction-related expenses during the period from January 1, 2006 through January 4, 2006 relating to the acquisition by
Rosetta Stone Inc. on January 4, 2006. Included in the expenses were $5.9 million related to restricted common stock, $3.1 million in cash bonuses and
$1.2 million in acquisition-related bank fees.
Successor Predecessor
Year Ended
December 31,
Period from
January 4,
through
December 31,
Period from
January 1,
through
January 4, Year Ended
December 31,
2009 2008 2007 2006 2006 2005
(in thousands, except per share data)
Statements of
Operations Data:
Revenue $252,271 $209,380 $137,321 $ 91,298 $ 272 $ 48,402
Cost of revenue 33,427 28,676 20,687 12,541 203 8,242
Gross profit 218,844 180,704 116,634 78,757 69 40,160
Operating expenses:
Sales and marketing 114,899 93,384 65,437 45,854 695 22,432
Research and
development 26,239 18,387 12,893 8,117 41 2,819
Acquired in-process
research and
development — — — 12,597 — —
General and
administrative 57,174 39,577 29,786 16,590 142 8,157
Lease abandonment — 1,831 — — — —
Transaction-related
expenses — — — — 10,315 —
Total operating
expenses 198,312 153,179 108,116 83,158 11,193 33,408
Income (loss) from
operations 20,532 27,525 8,518 (4,401) (11,124) 6,752
Other income and
expense:
Interest income 159 454 673 613 — 38
Interest expense (356) (891) (1,331) (1,560) — —
Other (expense)
income 112 239 154 60 3 134
Interest and other
income (expense), net (85) (198) (504) (887) 3 172
Income (loss) before
income taxes 20,447 27,327 8,014 (5,288) (11,121) 6,924
Income tax expense
(benefit) 7,084 13,435 5,435 (1,240) — 143
Net income (loss) 13,363 13,892 2,579 (4,048) (11,121) 6,781
Preferred stock accretion — — (80) (159) — —
Income (loss)
attributable to
common stockholders $ 13,363 $ 13,892 $ 2,499 $ (4,207) $ (11,121) $ 6,781
Income (loss) per share
attributable to
common
stockholders:
Basic $ 0.89 $ 7.29 $ 1.47 $ (2.63) $ (37,194) $ 24,658
Diluted $ 0.67 $ 0.82 $ 0.15 $ (2.63) $ (37,194) $ 24,658
Common shares and
equivalents
outstanding:
Basic weighted average
shares 14,990 1,905 1,702 1,598 0.299 0.275