Rosetta Stone 2009 Annual Report Download - page 100
Download and view the complete annual report
Please find page 100 of the 2009 Rosetta Stone annual report below. You can navigate through the pages in the report by either clicking on the pages listed below, or by using the keyword search tool below to find specific information within the annual report.-
 1
1 -
2
-
3
-
4
-
5
-
6
-
7
-
8
-
9
-
10
-
11
-
12
-
13
-
14
-
15
-
16
-
17
-
18
-
19
-
20
-
21
-
22
-
23
-
24
-
25
-
26
-
27
-
28
-
29
-
30
-
31
-
32
-
33
-
34
-
35
-
36
-
37
-
38
-
39
-
40
-
41
-
42
-
43
-
44
-
45
-
46
-
47
-
48
-
49
-
50
-
51
-
52
-
53
-
54
-
55
-
56
-
57
-
58
-
59
-
60
-
61
-
62
-
63
-
64
-
65
-
66
-
67
-
68
-
69
-
70
-
71
-
72
-
73
-
74
-
75
-
76
-
77
-
78
-
79
-
80
-
81
-
82
-
83
-
84
-
85
-
86
-
87
-
88
-
89
-
 90
90 -
 91
91 -
 92
92 -
 93
93 -
 94
94 -
 95
95 -
 96
96 -
 97
97 -
 98
98 -
 99
99 -
 100
100 -
 101
101 -
 102
102 -
 103
103 -
 104
104 -
 105
105 -
 106
106 -
 107
107 -
 108
108 -
 109
109 -
 110
110 -
111
-
112
-
113
-
114
-
115
-
116
-
117
-
118
-
119
-
120
-
121
-
122
-
123
-
124
-
125
-
126
-
127
-
128
 |
 |

Table of Contents
ROSETTA STONE INC.
NOTES TO CONSOLIDATED FINANCIAL STATEMENTS (Continued)
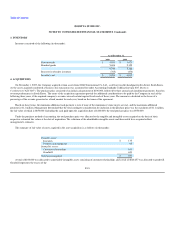
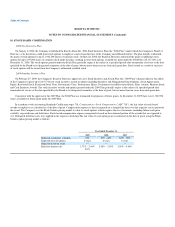
10. STOCK-BASED COMPENSATION (Continued)
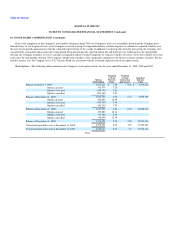
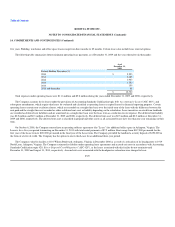
Prior to the completion of the Company's initial public offering in April 2009, the Company's stock was not publicly quoted and the Company had a
limited history of stock option activity, so the Company reviewed a group of comparable industry-related companies to estimate its expected volatility over
the most recent period commensurate with the estimated expected term of the awards. In addition to analyzing data from the peer group, the Company also
considered the contractual option term and vesting period when determining the expected option life and forfeiture rate. Subsequent to the initial public
offering, the Company continues to review a group of comparable industry-related companies to estimate volatility, but also reviews the volatility of its own
stock since the initial public offering. The Company considers the volatility of the comparable companies to be the best estimate of future volatility. For the
risk-free interest rate, the Company uses a U.S. Treasury Bond rate consistent with the estimated expected term of the option award.
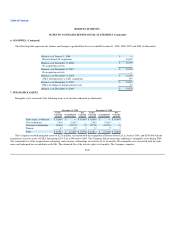
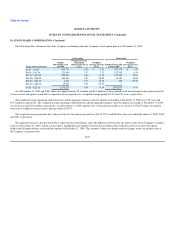
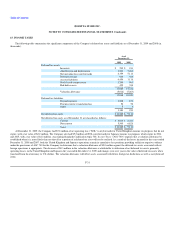
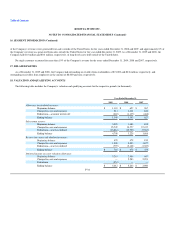
Stock Options—The following table summarizes the Company's stock option activity for the years ended December 31, 2009, 2008 and 2007:
Options
Outstanding
Weighted
Average
Exercise
Price
Weighted
Average
Contractual
Life (years)
Aggregate
Intrinsic
Value
Balance at January 1, 2007 1,531,231 $ 3.85 9.46 $ 3,415,823
Options granted 415,574 7.28
Options exercised (238,735) 3.85
Options cancelled (214,367) 4.53
Balance at December 31, 2007 1,493,703 4.70 8.70 9,695,391
Options granted 402,805 12.89
Options exercised (103,506) 3.96
Options cancelled (135,203) 7.97
Balance at December 31, 2008 1,657,799 6.48 8.05 18,268,386
Options granted 472,589 18.11
Options exercised (93,505) 5.10
Options cancelled (60,654) 12.48
Balance at December 31, 2009 1,976,229 9.14 7.58 17,511,103
Vested and expected to vest at December 31, 2008 1,572,720 6.23 7.99 17,722,546
Vested and expected to vest at December 31, 2009 1,878,917 8.73 7.5 17,396,124
F-24