Rosetta Stone 2009 Annual Report Download - page 78
Download and view the complete annual report
Please find page 78 of the 2009 Rosetta Stone annual report below. You can navigate through the pages in the report by either clicking on the pages listed below, or by using the keyword search tool below to find specific information within the annual report.-
 1
1 -
2
-
3
-
4
-
5
-
6
-
7
-
8
-
9
-
10
-
11
-
12
-
13
-
14
-
15
-
16
-
17
-
18
-
19
-
20
-
21
-
22
-
23
-
24
-
25
-
26
-
27
-
28
-
29
-
30
-
31
-
32
-
33
-
34
-
35
-
36
-
37
-
38
-
39
-
40
-
41
-
42
-
43
-
44
-
45
-
46
-
47
-
48
-
49
-
50
-
51
-
52
-
53
-
54
-
55
-
56
-
57
-
58
-
59
-
60
-
61
-
62
-
63
-
64
-
65
-
66
-
67
-
 68
68 -
 69
69 -
 70
70 -
 71
71 -
 72
72 -
 73
73 -
 74
74 -
 75
75 -
 76
76 -
 77
77 -
 78
78 -
 79
79 -
 80
80 -
 81
81 -
 82
82 -
 83
83 -
 84
84 -
 85
85 -
 86
86 -
 87
87 -
 88
88 -
89
-
90
-
91
-
92
-
93
-
94
-
95
-
96
-
97
-
98
-
99
-
100
-
101
-
102
-
103
-
104
-
105
-
106
-
107
-
108
-
109
-
110
-
111
-
112
-
113
-
114
-
115
-
116
-
117
-
118
-
119
-
120
-
121
-
122
-
123
-
124
-
125
-
126
-
127
-
128
 |
 |

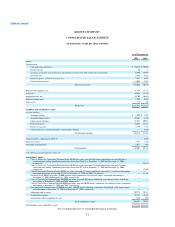
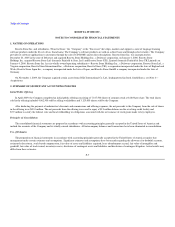
Table of Contents
ROSETTA STONE INC.
CONSOLIDATED STATEMENTS OF OPERATIONS
(in thousands except per share amounts)
Year Ended December 31,
2009 2008 2007
Revenue:
Product $ 218,549 $ 184,182 $ 119,897
Subscription and service 33,722 25,198 17,424
Total revenue 252,271 209,380 137,321
Cost of revenue:
Cost of product revenue 30,264 26,539 19,055
Cost of subscription and service revenue 3,163 2,137 1,632
Total cost of revenue 33,427 28,676 20,687
Gross profit 218,844 180,704 116,634
Operating expenses
Sales and marketing 114,899 93,384 65,437
Research and development 26,239 18,387 12,893
General and administrative 57,174 39,577 29,786
Lease abandonment — 1,831 —
Total operating expenses 198,312 153,179 108,116
Income from operations 20,532 27,525 8,518
Other income and expense:
Interest income 159 454 673
Interest expense (356) (891) (1,331)
Other income 112 239 154
Total other income (expense) (85) (198) (504)
Income before income taxes 20,447 27,327 8,014
Income tax provision 7,084 13,435 5,435
Net income 13,363 13,892 2,579
Preferred stock accretion — — (80)
Net income attributable to common shareholders $ 13,363 $ 13,892 $ 2,499
Net income per share attributable to common stockholders:
Basic $ 0.89 $ 7.29 $ 1.47
Diluted $ 0.67 $ 0.82 $ 0.15
Common shares and equivalents outstanding:
Basic weighted average shares 14,990 1,905 1,702
Diluted weighted average shares 19,930 16,924 16,533
See accompanying notes to consolidated financial statements.
F-4