Rosetta Stone 2009 Annual Report Download - page 45
Download and view the complete annual report
Please find page 45 of the 2009 Rosetta Stone annual report below. You can navigate through the pages in the report by either clicking on the pages listed below, or by using the keyword search tool below to find specific information within the annual report.-
 1
1 -
2
-
3
-
4
-
5
-
6
-
7
-
8
-
9
-
10
-
11
-
12
-
13
-
14
-
15
-
16
-
17
-
18
-
19
-
20
-
21
-
22
-
23
-
24
-
25
-
26
-
27
-
28
-
29
-
30
-
31
-
32
-
33
-
34
-
 35
35 -
 36
36 -
 37
37 -
 38
38 -
 39
39 -
 40
40 -
 41
41 -
 42
42 -
 43
43 -
 44
44 -
 45
45 -
 46
46 -
 47
47 -
 48
48 -
 49
49 -
 50
50 -
 51
51 -
 52
52 -
 53
53 -
 54
54 -
 55
55 -
56
-
57
-
58
-
59
-
60
-
61
-
62
-
63
-
64
-
65
-
66
-
67
-
68
-
69
-
70
-
71
-
72
-
73
-
74
-
75
-
76
-
77
-
78
-
79
-
80
-
81
-
82
-
83
-
84
-
85
-
86
-
87
-
88
-
89
-
90
-
91
-
92
-
93
-
94
-
95
-
96
-
97
-
98
-
99
-
100
-
101
-
102
-
103
-
104
-
105
-
106
-
107
-
108
-
109
-
110
-
111
-
112
-
113
-
114
-
115
-
116
-
117
-
118
-
119
-
120
-
121
-
122
-
123
-
124
-
125
-
126
-
127
-
128
 |
 |

Table of Contents
Successor Predecessor
Year Ended
December 31,
Period from
January 4, through
December 31,
Period from
January 1,
through
January 4, Year Ended
December 31,
2009 2008 2007 2006 2006 2005
(in thousands, except per share data)
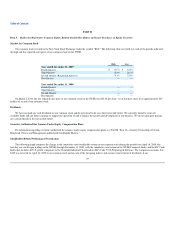
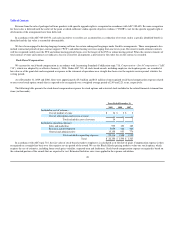
Other Data:
Stock-based
compensation
included in:
Cost of sales $ 34 $ 2 $ 2 $ 1 $ — $ —
Sales and marketing 999 153 189 59 — —
Research and
development 5,959 482 360 128 — —
General and
administrative 15,158 953 776 373 — —
Transaction-related
expenses — — — — 5,930 —
Total stock-based
compensation
expense $22,150 $1,590 $1,327 $ 561 $ 5,930 $ —
Intangible amortization
included in:
Cost of sales $ — $ 13 $1,227 $ 1,213 $ — $ —
Sales and marketing 42 3,003 3,596 4,113 — —
Total intangible
amortization
expense $ 42 $3,016 $4,823 $ 5,326 $ — $ —
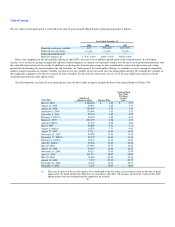
Sucessor Predecessor
Year Ended
December 31, Year Ended
December 31,
2009 2008 2007 2006 2005
(in thousands)
Consolidated Balance Sheet Data:
Cash and cash equivalents $ 95,188 $ 30,626 $ 21,691 $ 16,917 $ 11,738
Total assets 225,442 138,818 110,376 96,754 25,620
Deferred revenue 26,106 15,744 12,939 8,105 6,231
Notes payable and capital lease obligation — 9,910 13,324 15,917 63
Redeemable convertible preferred stock — — 5,000 4,920 —
Total stockholders' equity $ 156,435 $ 79,071 $ 58,125 $ 53,548 $ 8,985
42