Rosetta Stone 2009 Annual Report Download - page 57
Download and view the complete annual report
Please find page 57 of the 2009 Rosetta Stone annual report below. You can navigate through the pages in the report by either clicking on the pages listed below, or by using the keyword search tool below to find specific information within the annual report.-
 1
1 -
2
-
3
-
4
-
5
-
6
-
7
-
8
-
9
-
10
-
11
-
12
-
13
-
14
-
15
-
16
-
17
-
18
-
19
-
20
-
21
-
22
-
23
-
24
-
25
-
26
-
27
-
28
-
29
-
30
-
31
-
32
-
33
-
34
-
35
-
36
-
37
-
38
-
39
-
40
-
41
-
42
-
43
-
44
-
45
-
46
-
 47
47 -
 48
48 -
 49
49 -
 50
50 -
 51
51 -
 52
52 -
 53
53 -
 54
54 -
 55
55 -
 56
56 -
 57
57 -
 58
58 -
 59
59 -
 60
60 -
 61
61 -
 62
62 -
 63
63 -
 64
64 -
 65
65 -
 66
66 -
 67
67 -
68
-
69
-
70
-
71
-
72
-
73
-
74
-
75
-
76
-
77
-
78
-
79
-
80
-
81
-
82
-
83
-
84
-
85
-
86
-
87
-
88
-
89
-
90
-
91
-
92
-
93
-
94
-
95
-
96
-
97
-
98
-
99
-
100
-
101
-
102
-
103
-
104
-
105
-
106
-
107
-
108
-
109
-
110
-
111
-
112
-
113
-
114
-
115
-
116
-
117
-
118
-
119
-
120
-
121
-
122
-
123
-
124
-
125
-
126
-
127
-
128
 |
 |
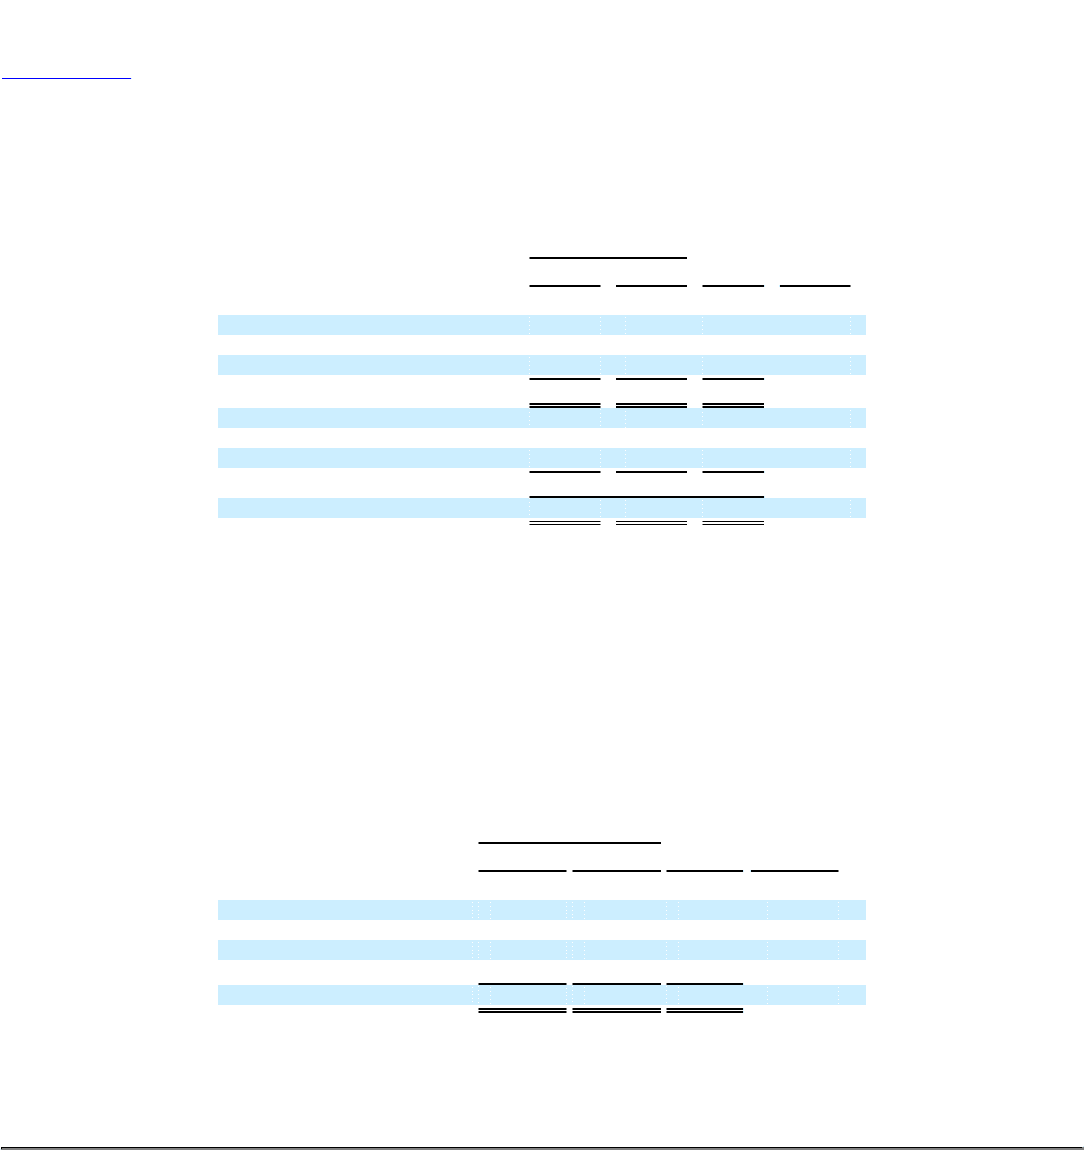
Table of Contents
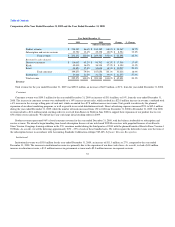
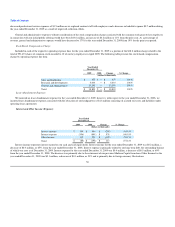
Product revenue represented 52% of total institutional revenue for the year ended December 31, 2009, and subscription and service revenue represented
48% for the same period.
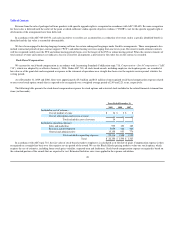
Cost of Revenue and Gross Profit
Year Ended
December 31,
2009 2008 Change % Change
(dollars in thousands)
Revenue:
Product $ 218,549 $ 184,182 $ 34,367 18.7%
Subscription and service 33,722 25,198 $ 8,524 33.8%
Total revenue $ 252,271 $ 209,380 $ 42,891 20.5%
Cost of revenue:
Cost of product revenue $ 30,264 $ 26,539 $ 3,725 14.0%
Cost of subscription and service revenue 3,163 2,137 $ 1,026 48.0%
Total cost of revenue 33,427 28,676 4,751 16.6%
Gross profit $ 218,844 $ 180,704 $ 38,140
Gross margin percentages 86.7% 86.3% 0.4%
Cost of revenue for the year ended December 31, 2009 was $33.4 million, an increase of $4.8 million, or 17%, from the year ended December 31, 2008.
As a percentage of total revenue, cost of revenue decreased to 13% for the year ended December 31, 2009 compared to 14% for the year ended December 31,
2008. The dollar increase in cost of revenue was primarily attributable to expansion of our product offering combined with a change in our sales mix, offset in
part by a reduction in affiliate commissions and the absence in the 2009 period of intangible amortization related to core technology associated with the
acquisition of Fairfield & Sons, Ltd., which was fully amortized in 2008. Cost of subscription and service revenue increased by $1.0 million or 48% as we
released Rosetta Stone TOTALe, our new web-based service offering that includes a component of dedicated language conversation coaching. We expect our
cost of revenue will increase as a percent of revenue as we begin bundling time-based subscription licenses of our web-based TOTALe services with perpetual
licenses of our Rosetta Stone Version 3 language learning solutions in the U.S. consumer market with the planned launch of Rosetta Stone Version 4 during
the third quarter of 2010.
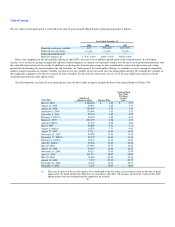
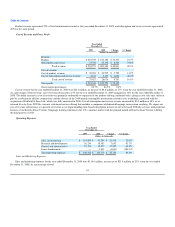
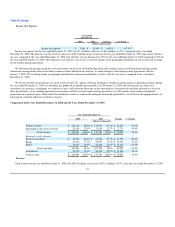
Operating Expenses
Year Ended
December 31,
2009 2008 Change % Change
(dollars in thousands)
Sales and marketing $ 114,899 $ 93,384 $ 21,515 23.0%
Research and development 26,239 18,387 7,852 42.7%
General and administrative 57,174 39,577 17,597 44.5%
Lease abandonment — 1,831 (1,831) (100.0)%
Total operating expenses $ 198,312 $ 153,179 $ 45,133 29.5%
Sales and Marketing Expenses
Sales and marketing expenses for the year ended December 31, 2009 were $114.9 million, an increase of $21.5 million, or 23%, from the year ended
December 31, 2008. As a percentage of total
54