Rosetta Stone 2009 Annual Report Download - page 52
Download and view the complete annual report
Please find page 52 of the 2009 Rosetta Stone annual report below. You can navigate through the pages in the report by either clicking on the pages listed below, or by using the keyword search tool below to find specific information within the annual report.-
 1
1 -
2
-
3
-
4
-
5
-
6
-
7
-
8
-
9
-
10
-
11
-
12
-
13
-
14
-
15
-
16
-
17
-
18
-
19
-
20
-
21
-
22
-
23
-
24
-
25
-
26
-
27
-
28
-
29
-
30
-
31
-
32
-
33
-
34
-
35
-
36
-
37
-
38
-
39
-
40
-
41
-
 42
42 -
 43
43 -
 44
44 -
 45
45 -
 46
46 -
 47
47 -
 48
48 -
 49
49 -
 50
50 -
 51
51 -
 52
52 -
 53
53 -
 54
54 -
 55
55 -
 56
56 -
 57
57 -
 58
58 -
 59
59 -
 60
60 -
 61
61 -
 62
62 -
63
-
64
-
65
-
66
-
67
-
68
-
69
-
70
-
71
-
72
-
73
-
74
-
75
-
76
-
77
-
78
-
79
-
80
-
81
-
82
-
83
-
84
-
85
-
86
-
87
-
88
-
89
-
90
-
91
-
92
-
93
-
94
-
95
-
96
-
97
-
98
-
99
-
100
-
101
-
102
-
103
-
104
-
105
-
106
-
107
-
108
-
109
-
110
-
111
-
112
-
113
-
114
-
115
-
116
-
117
-
118
-
119
-
120
-
121
-
122
-
123
-
124
-
125
-
126
-
127
-
128
 |
 |

Table of Contents
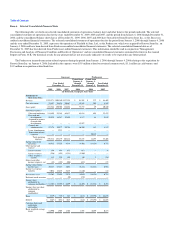
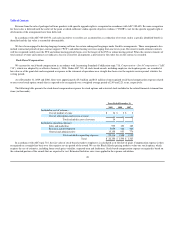
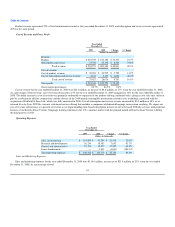
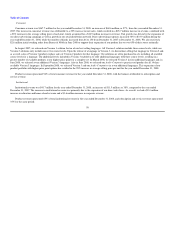
The fair value of each option grant is estimated on the date of grant using the Black Scholes option pricing model as follows:
Year Ended December 31,
2009 2008 2007
Expected stock price volatility 61% 57%-62% 62%-70%
Expected term of options 6 years 6 years 6 years
Expected dividend yield — — —
Risk-free interest rate 1.71%-2.46% 2.08%-3.36% 3.50%-4.96%
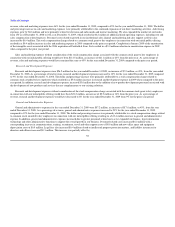
Prior to the completion of our initial public offering in April 2009, our stock was not publicly quoted and we had a limited history of stock option
activity, so we reviewed a group of comparable industry-related companies to estimate our expected volatility over the most recent period commensurate with
the estimated expected term of the awards. In addition to analyzing data from the peer group, we also considered the contractual option term and vesting
period when determining the expected option life and forfeiture rate. Subsequent to the initial public offering, we continue to review a group of comparable
industry-related companies to estimate volatility, but also review the volatility of our own stock since the initial public offering. We consider the volatility of
the comparable companies to be the best estimate of future volatility. For the risk-free interest rate, we use a U.S. Treasury Bond rate consistent with the
estimated expected term of the option award.
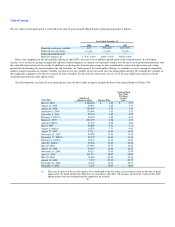
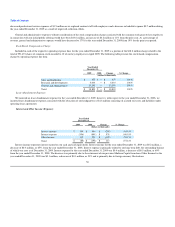
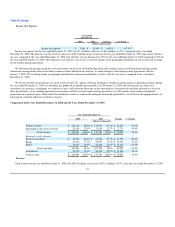
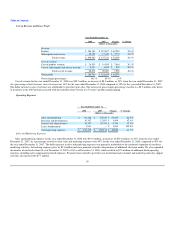
The following table sets forth all stock option grants since the date of plan inception, through the date of this Annual Report on Form 10-K:
Grant Date Number of
Options Granted Exercise Price
Common Stock
Fair Value
Per Share
at Grant
Date
May 22, 2006 1,366,456 $ 3.85 $ 4.57
August 16, 2006 29,861 3.85 5.10
August 21, 2006 149,500 3.85 5.14
September 5, 2006 130,000 3.85 5.25
December 8, 2006 29,133 3.85 5.92
February 2, 2007(1) 20,423 3.85 6.35
March 21, 2007 221,559 6.08 6.73
April 20, 2007(1) 31,330 6.08 6.98
June 5, 2007 59,800 7.31 7.31
August 3, 2007(1) 18,824 7.31 9.60
August 22, 2007 27,911 10.60 10.60
November 28, 2007 34,229 11.19 11.19
December 17, 2007(1) 22,178 10.60 11.30
February 8, 2008(1) 57,447 11.19 11.64
April 29, 2008(1) 99,346 11.64 10.36
May 28, 2008 110,916 10.36 10.36
August 19, 2008 36,075 14.22 14.22
November 19, 2008 99,021 17.49 17.49
April 15, 2009 441,911 18.00 18.00
May 28, 2009 15,000 22.30 22.30
August 19, 2009 1,974 20.35 20.35
November 18, 2009 12,445 16.74 16.74
December 7, 2009 1,259 18.05 18.05
The exercise price for these stock options was established at the fair value of our common stock on the date of grant
approval by the board of directors. However, in accordance with ASC 718, because all of the key terms of the stock
option grants were not communicated to employees on a timely
(1)
49