Rosetta Stone 2009 Annual Report Download - page 79
Download and view the complete annual report
Please find page 79 of the 2009 Rosetta Stone annual report below. You can navigate through the pages in the report by either clicking on the pages listed below, or by using the keyword search tool below to find specific information within the annual report.-
 1
1 -
2
-
3
-
4
-
5
-
6
-
7
-
8
-
9
-
10
-
11
-
12
-
13
-
14
-
15
-
16
-
17
-
18
-
19
-
20
-
21
-
22
-
23
-
24
-
25
-
26
-
27
-
28
-
29
-
30
-
31
-
32
-
33
-
34
-
35
-
36
-
37
-
38
-
39
-
40
-
41
-
42
-
43
-
44
-
45
-
46
-
47
-
48
-
49
-
50
-
51
-
52
-
53
-
54
-
55
-
56
-
57
-
58
-
59
-
60
-
61
-
62
-
63
-
64
-
65
-
66
-
67
-
68
-
 69
69 -
 70
70 -
 71
71 -
 72
72 -
 73
73 -
 74
74 -
 75
75 -
 76
76 -
 77
77 -
 78
78 -
 79
79 -
 80
80 -
 81
81 -
 82
82 -
 83
83 -
 84
84 -
 85
85 -
 86
86 -
 87
87 -
 88
88 -
 89
89 -
90
-
91
-
92
-
93
-
94
-
95
-
96
-
97
-
98
-
99
-
100
-
101
-
102
-
103
-
104
-
105
-
106
-
107
-
108
-
109
-
110
-
111
-
112
-
113
-
114
-
115
-
116
-
117
-
118
-
119
-
120
-
121
-
122
-
123
-
124
-
125
-
126
-
127
-
128
 |
 |

Table of Contents
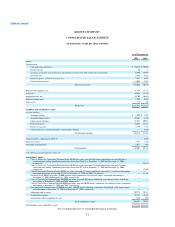
ROSETTA STONE INC.
CONSOLIDATED STATEMENTS OF CHANGES IN STOCKHOLDERS' EQUITY
(in thousands)
Class A,
Series A-1
Convertible
Preferred Stock
Class A,
Series A-2
Convertible
Preferred Stock
Class B
Convertible
Preferred Stock
Class A
Convertible
Common Stock
Class B
Convertible
Common Stock
Non-
Designated
Common Stock
Accumulated
Other
Comprehensive
Income
(loss)
Additional
Paid-in
Capital
Accumulated
Income
(loss)
Total
Stockholders'
Equity
Shares Amount Shares Amount Shares Amount Shares Amount Shares Amount Shares Amount
Balance—
January 1, 269 $ 26,876 178 $ 17,820 63 $ 6,341 — $ — — $ — 1,612 $ 1 $ 6,601 $ (4,049) $ (42) $ 53,548
Stock issued upon
the exercise of
stock options — — — — — — — — — — 225 — 765 — — 765
Stock-based
compensation
expense — — — — — — — — — — — — 1,327 — — 1,327
Accretion of
Redeemable
Convertible
Class B
Preferred Stock
to redemption — — — — — — — — — — — — (80) — — (80)
Comprehensive
income (loss):
Net income — — — — — — — — — — — — — 2,579 — 2,579
Foreign currency
translation
loss, net of tax
of $6 — — — — — — — — — — — — — — (14) (14)
comprehensive
income — — — — — — — — — — — — — — — 2,565
Balance—
December 31, 269 26,876 178 17,820 63 6,341 — — — — 1,837 1 8,613 (1,470) (56) 58,125
Stock issed upon
the exercise of
stock options — — — — — — — — — — 99 — 365 — — 365
Stock-based
compensation
expense — — — — — — — — — — — — 1,590 — — 1,590
Tax benefit on
stock options
exercised — — — — — — — — — — — — 246 — — 246
Expiration of
redemption
rights of Class B
Redeemable
Convertible
Preferred Stock — — — — 48 5,000 — — — — — — — — — 5,000
Comprehensive
income:
Net income — — — — — — — — — — — — — 13,892 — 13,892
Foreign currency
translation
loss, net of tax
of $52 — — — — — — — — — — — — — — (147) (147)
comprehensive
income — — — — — — — — — — — — — — — 13,745
Balance—
December 31, 269 $ 26,876 178 $ 17,820 111 $ 11,341 — $ — — $ — 1,936 $ 1 $ 10,814 $ 12,422 $ (203) $ 79,071
Stock issed upon
the exercise of
stock options — — — — — — — — — — 89 — 386 — — 386
Stock issued to
employees — — — — — — — — — — 591 — 10,647 — — 10,647
Stock-based
compensation
expense — — — — — — — — — — — — 3,616 — — 3,616
Tax benefit on
stock options
exercised — — — — — — — — — — — — 336 — — 336
Conversion of
preferred stock (269) (26,876) (178) (17,820) (111) (11,341) — — — — 14,508 1 56,036 — — —
Sale of common
stock — — — — — — — — — — 3,125 — 49,037 — — 49,037
Comprehensive
income:
Net income — — — — — — — — — — — — — 13,363 — 13,363
Foreign currency
translation — — — — — — — — — — — — — — (21) (21)