Pfizer 2012 Annual Report Download - page 95
Download and view the complete annual report
Please find page 95 of the 2012 Pfizer annual report below. You can navigate through the pages in the report by either clicking on the pages listed below, or by using the keyword search tool below to find specific information within the annual report.-
 1
1 -
2
-
3
-
4
-
5
-
6
-
7
-
8
-
9
-
10
-
11
-
12
-
13
-
14
-
15
-
16
-
17
-
18
-
19
-
20
-
21
-
22
-
23
-
24
-
25
-
26
-
27
-
28
-
29
-
30
-
31
-
32
-
33
-
34
-
35
-
36
-
37
-
38
-
39
-
40
-
41
-
42
-
43
-
44
-
45
-
46
-
47
-
48
-
49
-
50
-
51
-
52
-
53
-
54
-
55
-
56
-
57
-
58
-
59
-
60
-
61
-
62
-
63
-
64
-
65
-
66
-
67
-
68
-
69
-
70
-
71
-
72
-
73
-
74
-
75
-
76
-
77
-
78
-
79
-
80
-
81
-
82
-
83
-
84
-
 85
85 -
 86
86 -
 87
87 -
 88
88 -
 89
89 -
 90
90 -
 91
91 -
 92
92 -
 93
93 -
 94
94 -
 95
95 -
 96
96 -
 97
97 -
 98
98 -
 99
99 -
 100
100 -
 101
101 -
 102
102 -
 103
103 -
 104
104 -
 105
105 -
106
-
107
-
108
-
109
-
110
-
111
-
112
-
113
-
114
-
115
-
116
-
117
-
118
-
119
-
120
-
121
 |
 |

Notes to Consolidated Financial Statements
Pfizer Inc. and Subsidiary Companies
94
2012 Financial Report
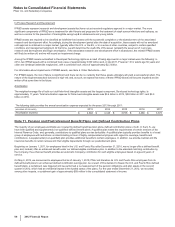
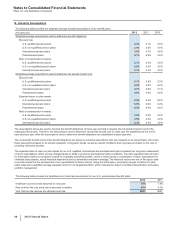
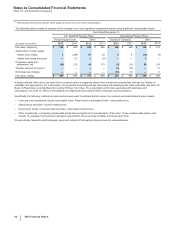
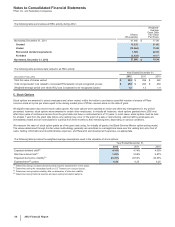
The following table provides the expected future cash flow information related to our benefit plans:
Pension Plans
(MILLIONS OF DOLLARS) U.S.Qualified
U.S. Supplemental
(Non-Qualified) International Postretirement Plans
Expected employer contributions:
2013 $ —$162 $343 $257
Expected benefit payments:
2013 $ 1,115 $162 $444 $295
2014 782 137 400 306
2015 796 116 417 313
2016 812 111 430 321
2017 856 114 442 329
2018–2022 4,595 561 2,396 1,748
The table reflects the total U.S. and international plan benefits projected to be paid from the plans or from our general assets under the current
actuarial assumptions used for the calculation of the benefit obligation and, therefore, actual benefit payments may differ from projected
benefit payments.
F. Defined Contribution Plans
We have savings and investment plans in several countries, including the U.S., U.K., Japan, Spain and the Netherlands. For the U.S. plans,
employees may contribute a portion of their salaries and bonuses to the plans, and we match, largely in company stock or company stock
units, a portion of the employee contributions. In the U.S., the matching contributions in company stock are sourced through open market
purchases. Employees are permitted to subsequently diversify all or any portion of their company matching contribution. The contribution
match for certain legacy Pharmacia U.S. participants is held in an employee stock ownership plan. We recorded charges related to our plans
of $297 million in 2012, $288 million in 2011 and $259 million in 2010.
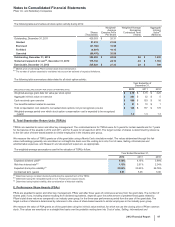
Note 12. Equity
A. Common Stock
We purchase our common stock through privately negotiated transactions or in open market purchases as circumstances and prices warrant.
Purchased shares under each of the share-purchase plans, which are authorized by our Board of Directors, are available for general corporate
purposes. On December 12, 2011, we announced that the Board of Directors had authorized a $10 billion share-purchase plan (the December
2011 Stock Purchase Plan). On November 1, 2012, we announced that the Board of Directors had authorized an additional $10 billion share-
purchase plan, which became effective on November 30, 2012.
In 2012, we purchased approximately 349 million shares of our common stock for approximately $8.2 billion. In 2011, we purchased
approximately 459 million shares of our common stock for approximately $9.0 billion. In 2010, we purchased approximately 61 million shares
of our common stock for approximately $1 billion. After giving effect to share purchases through year-end 2012, our remaining share-purchase
authorization is approximately $11.8 billion at December 31, 2012.
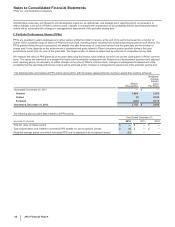
B. Preferred Stock
The Series A convertible perpetual preferred stock is held by an Employee Stock Ownership Plan (Preferred ESOP) Trust and provides
dividends at the rate of 6.25%, which are accumulated and paid quarterly. The per-share stated value is $40,300 and the preferred stock ranks
senior to our common stock as to dividends and liquidation rights. Each share is convertible, at the holder’s option, into 2,574.87 shares of our
common stock with equal voting rights. The conversion option is indexed to our common stock and requires share settlement, and, therefore,
is reported at the fair value at the date of issuance. We may redeem the preferred stock at any time or upon termination of the Preferred
ESOP, at our option, in cash, in shares of common stock, or a combination of both at a price of $40,300 per share.
C. Employee Stock Ownership Plans
We have two employee stock ownership plans (collectively, the ESOPs), the Preferred ESOP and another that holds common stock of the
Company (Common ESOP).
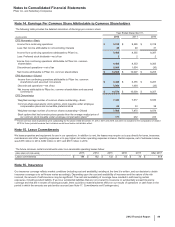
Allocated shares held by the Common ESOP are considered outstanding for the earnings per share (EPS) calculations and the eventual
conversion of allocated preferred shares held by the Preferred ESOP is assumed in the diluted EPS calculation. As of December 31, 2012, the
Preferred ESOP held preferred shares with a stated value of approximately $39 million, convertible into approximately 2 million shares of our
common stock. As of December 31, 2012, the Common ESOP held approximately 3 million shares of our common stock. As of December 31,
2012, all preferred and common shares held by the ESOPs have been allocated to the Pharmacia U.S. and certain Puerto Rico savings plan
participants.