Pfizer 2012 Annual Report Download - page 120
Download and view the complete annual report
Please find page 120 of the 2012 Pfizer annual report below. You can navigate through the pages in the report by either clicking on the pages listed below, or by using the keyword search tool below to find specific information within the annual report.-
 1
1 -
2
-
3
-
4
-
5
-
6
-
7
-
8
-
9
-
10
-
11
-
12
-
13
-
14
-
15
-
16
-
17
-
18
-
19
-
20
-
21
-
22
-
23
-
24
-
25
-
26
-
27
-
28
-
29
-
30
-
31
-
32
-
33
-
34
-
35
-
36
-
37
-
38
-
39
-
40
-
41
-
42
-
43
-
44
-
45
-
46
-
47
-
48
-
49
-
50
-
51
-
52
-
53
-
54
-
55
-
56
-
57
-
58
-
59
-
60
-
61
-
62
-
63
-
64
-
65
-
66
-
67
-
68
-
69
-
70
-
71
-
72
-
73
-
74
-
75
-
76
-
77
-
78
-
79
-
80
-
81
-
82
-
83
-
84
-
85
-
86
-
87
-
88
-
89
-
90
-
91
-
92
-
93
-
94
-
95
-
96
-
97
-
98
-
99
-
100
-
101
-
102
-
103
-
104
-
105
-
106
-
107
-
108
-
109
-
 110
110 -
 111
111 -
 112
112 -
 113
113 -
 114
114 -
 115
115 -
 116
116 -
 117
117 -
 118
118 -
 119
119 -
 120
120 -
 121
121
 |
 |

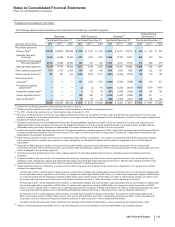
Financial Summary
Pfizer Inc. and Subsidiary Companies
2012 Financial Report
119
Year Ended/As of December 31,(a)
(MILLIONS, EXCEPT PER COMMON SHARE DATA) 2012 2011 2010 2009 2008
Revenues $ 58,986 $ 65,259 $ 65,165 $ 49,078 $47,529
Research and development expenses(b) 7,870 9,074 9,483 7,887 8,557
Other costs and expenses 37,156 40,951 43,066 26,138 26,790
Restructuring charges and certain acquisition-related costs(c) 1,880 2,930 3,145 4,330 2,662
Income from continuing operations before provision for taxes on income 12,080 12,304 9,471 10,723 9,520
Provision for taxes on income 2,562 3,909 1,153 2,150 1,582
Income from continuing operations 9,518 8,395 8,318 8,573 7,938
Discontinued operations—net of tax(d) 5,080 1,654 (30) 71 188
Less: Net income attributable to noncontrolling interests 28 40 31 9 22
Net income attributable to Pfizer Inc. $ 14,570 $ 10,009 $ 8,257 $ 8,635 $ 8,104
Effective tax rate—continuing operations 21.2% 31.8% 12.2% 20.1%16.6%
Depreciation and amortization(e) $ 7,611 $ 8,907 $ 8,399 $ 4,757 $ 5,090
Property, plant and equipment additions(e) 1,327 1,660 1,513 1,205 1,701
Cash dividends paid 6,534 6,234 6,088 5,548 8,541
Working capital 32,796 31,908 35,764 28,537 16,748
Property, plant and equipment, less accumulated depreciation 14,461 15,921 17,607 21,316 12,864
Total assets 185,798 188,002 195,014 212,949 111,148
Long-term debt 31,036 34,926 38,410 43,192 7,955
Long-term capital(f) 134,307 136,408 144,542 150,562 68,637
Total Pfizer Inc. shareholders’ equity 81,260 82,190 87,813 90,014 57,556
Earnings per common share—basic(g)
Income from continuing operations attributable to Pfizer Inc. common
shareholders $1.27$ 1.07 $ 1.03 $ 1.22 $1.18
Discontinued operations—net of tax 0.68 0.21 — 0.01 0.03
Net income attributable to Pfizer Inc. common shareholders $1.96$ 1.28 $ 1.03 $ 1.23 $1.20
Earnings per common share—diluted(g)
Income from continuing operations attributable to Pfizer Inc. common
shareholders $1.26$ 1.06 $ 1.03 $ 1.22 $1.17
Discontinued operations—net of tax 0.68 0.21 — 0.01 0.03
Net income attributable to Pfizer Inc. common shareholders $1.94$ 1.27 $ 1.02 $ 1.23 $1.20
Market value per share (December 31) $ 25.08 $ 21.64 $ 17.51 $ 18.19 $ 17.71
Return on Pfizer Inc. shareholders’ equity 17.83% 11.78% 10.39% 13.42% 13.22%
Cash dividends paid per common share $0.88$ 0.80 $ 0.72 $ 0.80 $1.28
Pfizer Inc. shareholders’ equity per common share(h) $ 11.17 $ 10.85 $ 10.96 $ 11.19 $ 8.56
Current ratio 2.15:1 2.10:1 2.21:1 1.75:1 1.61:1
Weighted-average shares—basic 7,442 7,817 8,036 7,007 6,727
Weighted-average shares—diluted 7,508 7,870 8,074 7,045 6,750
(a) For 2011, includes King commencing on the acquisition date of January 31, 2011. For 2009, includes Wyeth commencing on the acquisition date of October 15,
2009.
(b) Research and development expenses includes upfront and milestone payments for intellectual property rights of $371 million in 2012, $306 million in 2011;
$393 million in 2010; $489 million in 2009; and $377 million in 2008.
(c) Restructuring charges and certain acquisition-related costs primarily includes the following:
2012—Restructuring charges of $1.5 billion related to our cost-reduction and productivity initiatives.
2011—Restructuring charges of $2.2 billion related to our acquisition of Wyeth and other cost-reduction initiatives.
2010—Restructuring charges of $2.1 billion related to our acquisition of Wyeth and other cost-reduction initiatives.
2009—Restructuring charges of $3.0 billion related to our cost-reduction initiatives.
2008—Restructuring charges of $2.6 billion related to our cost-reduction initiatives.
(d) The sale of our Nutrition business closed on November 30, 2012. 2012, 2011, 2010 and 2009 reflect the Nutrition business, which was acquired in 2009, as a
discontinued operation. All financial information before 2012 reflects Capsugel (the sale of which closed on August 1, 2011) as a discontinued operation.
(e) Includes discontinued operations.
(f) Defined as long-term debt, noncurrent deferred tax liabilities and total equity. In 2009, increase reflects the long-term debt and deferred tax liabilities associated
with the acquisition of Wyeth.
(g) EPS amounts may not add due to rounding.
(h) Represents total Pfizer Inc. shareholders’ equity divided by the actual number of common shares outstanding (which excludes treasury shares and those held
by our employee benefit trusts). The increase in 2009 was due to the issuance of equity to partially finance the Wyeth acquisition.