Pfizer 2012 Annual Report Download - page 91
Download and view the complete annual report
Please find page 91 of the 2012 Pfizer annual report below. You can navigate through the pages in the report by either clicking on the pages listed below, or by using the keyword search tool below to find specific information within the annual report.-
 1
1 -
2
-
3
-
4
-
5
-
6
-
7
-
8
-
9
-
10
-
11
-
12
-
13
-
14
-
15
-
16
-
17
-
18
-
19
-
20
-
21
-
22
-
23
-
24
-
25
-
26
-
27
-
28
-
29
-
30
-
31
-
32
-
33
-
34
-
35
-
36
-
37
-
38
-
39
-
40
-
41
-
42
-
43
-
44
-
45
-
46
-
47
-
48
-
49
-
50
-
51
-
52
-
53
-
54
-
55
-
56
-
57
-
58
-
59
-
60
-
61
-
62
-
63
-
64
-
65
-
66
-
67
-
68
-
69
-
70
-
71
-
72
-
73
-
74
-
75
-
76
-
77
-
78
-
79
-
80
-
 81
81 -
 82
82 -
 83
83 -
 84
84 -
 85
85 -
 86
86 -
 87
87 -
 88
88 -
 89
89 -
 90
90 -
 91
91 -
 92
92 -
 93
93 -
 94
94 -
 95
95 -
 96
96 -
 97
97 -
 98
98 -
 99
99 -
 100
100 -
 101
101 -
102
-
103
-
104
-
105
-
106
-
107
-
108
-
109
-
110
-
111
-
112
-
113
-
114
-
115
-
116
-
117
-
118
-
119
-
120
-
121
 |
 |

Notes to Consolidated Financial Statements
Pfizer Inc. and Subsidiary Companies
90
2012 Financial Report
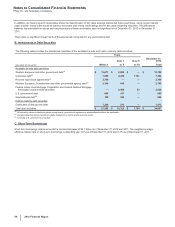
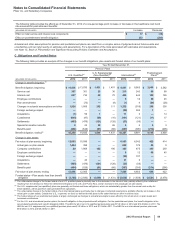
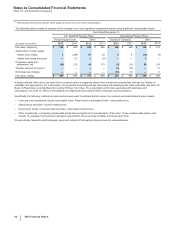
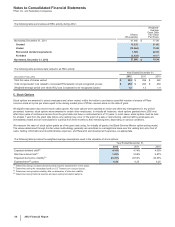
The following table provides information as to how the funded status is recognized in our consolidated balance sheets:
As of December 31,
Pension Plans
U.S. Qualified U.S. Supplemental
(Non-Qualified) International Postretirement
Plans
(MILLIONS OF DOLLARS) 2012 2011 2012 2011 2012 2011 2012 2011
Noncurrent assets(a) $—$—$—$—$124 $327 $—$—
Current liabilities(b) ——(162)(130)(47)(41)(28)(134)
Noncurrent liabilities(c) (3,728) (2,830) (1,387)(1,301) (2,715) (2,224) (3,493)(3,344)
Funded status $ (3,728) $ (2,830) $(1,549)$(1,431)$ (2,638) $ (1,938) $(3,521)$(3,478)
(a) Included primarily in Taxes and other noncurrent assets.
(b) Included in Accrued compensation and related items.
(c) Included in Pension benefit obligations and Postretirement benefit obligations, as appropriate.
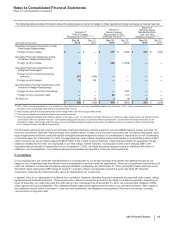
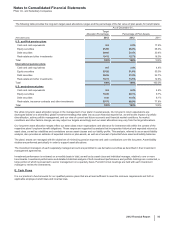
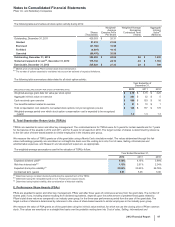
The following table provides the pre-tax components of amounts recognized in Accumulated other comprehensive loss:
As of December 31,
Pension Plans
U.S. Qualified U.S. Supplemental
(Non-Qualified) International Postretirement
Plans
(MILLIONS OF DOLLARS) 2012 2011 2012 2011 2012 2011 2012 2011
Actuarial losses(a) $ (5,027) $ (4,638) $(664)$(566)$(2,780)$ (2,020) $(932)$(759)
Prior service (costs)/credits and other 51 123 14 26 (20)(21)374 468
Total $ (4,976) $ (4,515) $(650)$(540)$ (2,800) $ (2,041) $ (558) $(291)
(a) The actuarial losses primarily represent the impact of changes in discount rates and other assumptions that result in cumulative changes in our projected
benefit obligations as well as the cumulative difference between the expected return and actual return on plan assets. These actuarial losses are recognized in
Accumulated other comprehensive loss and are amortized into net periodic benefit costs over an average period of 9.8 years for our U.S. qualified plans, an
average period of 9.9 years for our U.S. supplemental (non-qualified) plans, an average period of 14.5 years for our international plans and an average period
of 11.0 years for our postretirement plans.
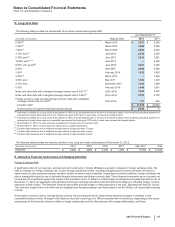
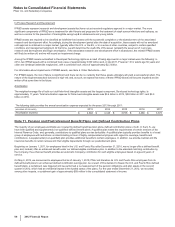
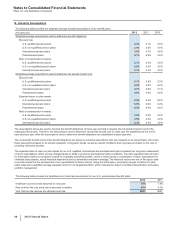
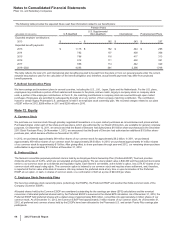
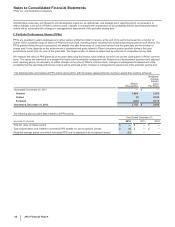
The following table provides information related to the funded status of selected benefit plans:
As of December 31,
Pension Plans
U.S. Qualified
U.S. Supplemental
(Non-Qualified) International
(MILLIONS OF DOLLARS) 2012 2011 2012 2011 2012 2011
Pension plans with an accumulated benefit obligation in excess of
plan assets:
Fair value of plan assets $12,540 $12,005 $—$—$2,776 $2,529
Accumulated benefit obligation 15,870 13,799 1,465 1,225 5,056 4,446
Pension plans with a projected benefit obligation in excess of plan
assets:
Fair value of plan assets 12,540 12,005 ——6,432 2,686
Projected benefit obligation 16,268 14,835 1,549 1,431 9,193 4,951
All of our U.S. plans and substantially all of our international plans were underfunded as of December 31, 2012.