Pfizer 2012 Annual Report Download - page 71
Download and view the complete annual report
Please find page 71 of the 2012 Pfizer annual report below. You can navigate through the pages in the report by either clicking on the pages listed below, or by using the keyword search tool below to find specific information within the annual report.-
 1
1 -
2
-
3
-
4
-
5
-
6
-
7
-
8
-
9
-
10
-
11
-
12
-
13
-
14
-
15
-
16
-
17
-
18
-
19
-
20
-
21
-
22
-
23
-
24
-
25
-
26
-
27
-
28
-
29
-
30
-
31
-
32
-
33
-
34
-
35
-
36
-
37
-
38
-
39
-
40
-
41
-
42
-
43
-
44
-
45
-
46
-
47
-
48
-
49
-
50
-
51
-
52
-
53
-
54
-
55
-
56
-
57
-
58
-
59
-
60
-
 61
61 -
 62
62 -
 63
63 -
 64
64 -
 65
65 -
 66
66 -
 67
67 -
 68
68 -
 69
69 -
 70
70 -
 71
71 -
 72
72 -
 73
73 -
 74
74 -
 75
75 -
 76
76 -
 77
77 -
 78
78 -
 79
79 -
 80
80 -
 81
81 -
82
-
83
-
84
-
85
-
86
-
87
-
88
-
89
-
90
-
91
-
92
-
93
-
94
-
95
-
96
-
97
-
98
-
99
-
100
-
101
-
102
-
103
-
104
-
105
-
106
-
107
-
108
-
109
-
110
-
111
-
112
-
113
-
114
-
115
-
116
-
117
-
118
-
119
-
120
-
121
 |
 |

Notes to Consolidated Financial Statements
Pfizer Inc. and Subsidiary Companies
70
2012 Financial Report
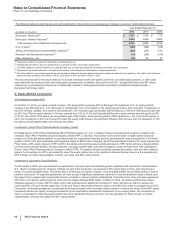
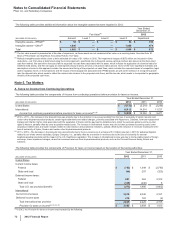
The restructuring charges in 2011 are associated with the following:
• Primary Care operating segment ($593 million), Specialty Care and Oncology operating segment ($220 million), Established Products and Emerging
Markets operating segment ($110 million), Animal Health operating segment ($45 million), Consumer Healthcare operating segment ($8 million),
research and development operations ($490 million), manufacturing operations ($287 million) and Corporate ($422 million).
The restructuring charges in 2010 are associated with the following:
•Primary Care operating segment ($71 million), Specialty Care and Oncology operating segment ($197 million), Established Products and Emerging
Markets operating segment ($43 million), Animal Health operating segment ($34 million), Consumer Healthcare operating segment ($12 million),
research and development operations ($297 million), manufacturing operations ($1.1 billion) and Corporate ($350 million).
(d) Additional depreciation––asset restructuring represents the impact of changes in the estimated useful lives of assets involved in restructuring actions.
(e) Implementation costs represent external, incremental costs directly related to implementing our non-acquisition-related cost-reduction/productivity initiatives.
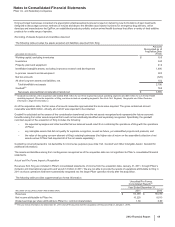
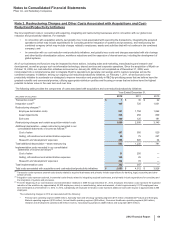
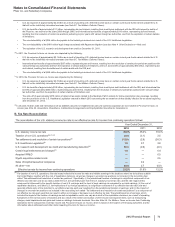
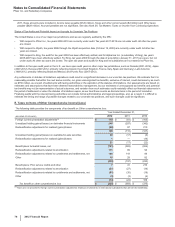
The following table provides the components of and changes in our restructuring accruals:
(MILLIONS OF DOLLARS)
Employee
Termination
Costs
Asset
Impairment
Charges Exit Costs Accrual
Balance, January 1, 2011 $ 2,149 $—$
101 $2,250
Provision 1,794 256 125 2,175
Utilization and other(a) (1,518) (256)(134)(1,908)
Balance, December 31, 2011(b) 2,425 —92
2,517
Provision 997 328 149 1,474
Utilization and other(a) (1,629) (328)(84)(2,041)
Balance, December 31, 2012(c) $1,793 $—$
157 $1,950
(a) Includes adjustments for foreign currency translation.
(b) Included in Other current liabilities ($1.6 billion) and Other noncurrent liabilities ($930 million).
(c) Included in Other current liabilities ($1.2 billion) and Other noncurrent liabilities ($731 million).
Total restructuring charges incurred from the beginning of our cost-reduction and productivity initiatives in 2005 through December 31, 2012
were $15.6 billion.
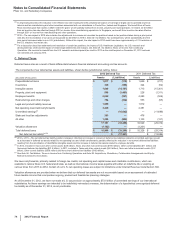
The asset impairment charges included in restructuring charges for 2012 primarily relate to assets held for sale and are based on an estimate
of fair value, which was determined to be lower than the carrying value of the assets prior to the impairment charge.
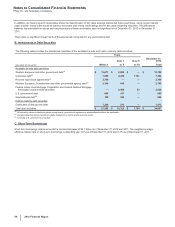
The following table provides additional information about the long-lived assets held for sale that were impaired in 2012:
Fair Value(a)
Year Ended
December 31,
2012
(MILLIONS OF DOLLARS) Amount Level 1 Level 2 Level 3 Impairment
Long-lived assets(b) $ 139 $ — $ 139 $—$ 210
(a) The fair value amount is presented as of the date of impairment, as these assets are not measured at fair value on a recurring basis. See also Note 1E. Basis of
Presentation and Significant Accounting Policies: Fair Value.
(b) Reflects property, plant and equipment and other long-lived held-for-sale assets written down to their fair value of $139 million, less costs to sell of $3 million (a
net of $136 million), in 2012. The impairment charges of $210 million are included in Restructuring charges and certain acquisition-related costs. Fair value is
determined primarily using a market approach, with various inputs, such as recent sales transactions.