Pfizer 2012 Annual Report Download - page 90
Download and view the complete annual report
Please find page 90 of the 2012 Pfizer annual report below. You can navigate through the pages in the report by either clicking on the pages listed below, or by using the keyword search tool below to find specific information within the annual report.-
 1
1 -
2
-
3
-
4
-
5
-
6
-
7
-
8
-
9
-
10
-
11
-
12
-
13
-
14
-
15
-
16
-
17
-
18
-
19
-
20
-
21
-
22
-
23
-
24
-
25
-
26
-
27
-
28
-
29
-
30
-
31
-
32
-
33
-
34
-
35
-
36
-
37
-
38
-
39
-
40
-
41
-
42
-
43
-
44
-
45
-
46
-
47
-
48
-
49
-
50
-
51
-
52
-
53
-
54
-
55
-
56
-
57
-
58
-
59
-
60
-
61
-
62
-
63
-
64
-
65
-
66
-
67
-
68
-
69
-
70
-
71
-
72
-
73
-
74
-
75
-
76
-
77
-
78
-
79
-
 80
80 -
 81
81 -
 82
82 -
 83
83 -
 84
84 -
 85
85 -
 86
86 -
 87
87 -
 88
88 -
 89
89 -
 90
90 -
 91
91 -
 92
92 -
 93
93 -
 94
94 -
 95
95 -
 96
96 -
 97
97 -
 98
98 -
 99
99 -
 100
100 -
101
-
102
-
103
-
104
-
105
-
106
-
107
-
108
-
109
-
110
-
111
-
112
-
113
-
114
-
115
-
116
-
117
-
118
-
119
-
120
-
121
 |
 |

Notes to Consolidated Financial Statements
Pfizer Inc. and Subsidiary Companies
2012 Financial Report
89
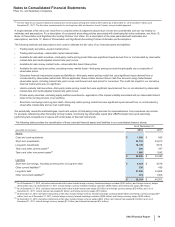
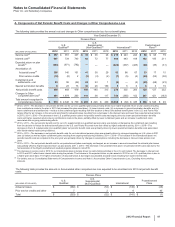
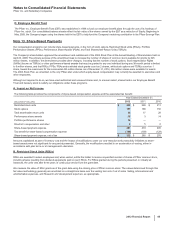
The following table provides the effects as of December 31, 2012 of a one-percentage-point increase or decrease in the healthcare cost trend
rate assumed for postretirement benefits:
(MILLIONS OF DOLLARS) Increase Decrease
Effect on total service and interest cost components $17$
(16)
Effect on postretirement benefit obligation 333 (293)
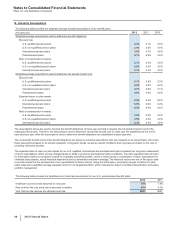
Actuarial and other assumptions for pension and postretirement plans can result from a complex series of judgments about future events and
uncertainties and can rely heavily on estimates and assumptions. For a description of the risks associated with estimates and assumptions,
see Note 1C. Basis of Presentation and Significant Accounting Policies: Estimates and Assumptions.
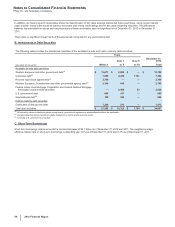
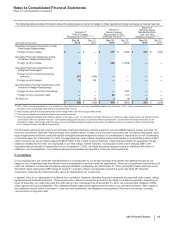
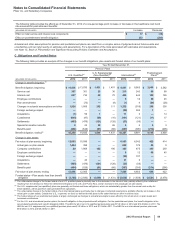
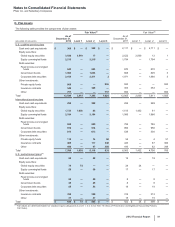
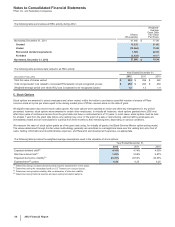
C .Obligations and Funded Status
The following table provides an analysis of the changes in our benefit obligations, plan assets and funded status of our benefit plans:
Year Ended December 31,
Pension Plans
U.S. Qualified(a) U.S. Supplemental
(Non-Qualified)(b) International(c) Postretirement
Plans(d)
(MILLIONS OF DOLLARS) 2012 2011 2012 2011 2012 2011 2012 2011
Change in benefit obligation (e)
Benefit obligation, beginning $ 14,835 $13,035 $1,431 $1,401 $8,891 $8,965 $3,900 $ 3,582
Service cost 357 351 35 36 215 243 68 68
Interest cost 697 734 62 72 406 443 182 195
Employee contributions ————912 58 45
Plan amendments —(73) —(9) (1) 4(24)(28)
Changes in actuarial assumptions and other 1,926 1,808 252 111 1,232 (516)259 300
Foreign exchange impact ————(80) 304 1—
Acquisitions (1) 56 1—71 3—14
Curtailments (605)(97) (80)(10)(101) (121)(11)17
Settlements (485)(476)(121)(128)(33) (56)——
Special termination benefits 823 30 26 5563
Benefits paid (464)(526)(61)(68)(387) (395)(274)(296)
Benefit obligation, ending(e) 16,268 14,835 1,549 1,431 10,227 8,891 4,165 3,900
Change in plan assets
Fair value of plan assets, beginning 12,005 10,596 ——6,953 6,542 422 414
Actual gain on plan assets 1,464 398 ——668 176 85 9
Company contributions 20 1,969 182 196 383 475 353 250
Employee contributions ————912 58 45
Foreign exchange impact ————(35) 197 ——
Acquisitions —44 ——31 2——
Settlements (485)(476)(121)(128)(33) (56)——
Benefits paid (464)(526)(61)(68)(387) (395)(274)(296)
Fair value of plan assets, ending 12,540 12,005 ——7,589 6,953 644 422
Funded status—Plan assets less than benefit
obligation $ (3,728) $ (2,830) $ (1,549) $ (1,431) $ (2,638) $(1,938)$(3,521)$(3,478)
(a) The unfavorable change in the funded status of our U.S. qualified plans is primarily due to the decrease in the discount rate, partially offset by the curtailment
resulting from the decision to freeze the defined benefit plans in the U.S. and Puerto Rico, and an increase in the actual gain on plan assets.
(b) Our U.S. supplemental (non-qualified) plans are generally not funded and these obligations, which are substantially greater than the annual cash outlay for
these liabilities, will be paid from cash generated from operations.
(c) The unfavorable change in the funded status of our international plans is primarily due to changes in actuarial assumptions, partially offset by an increase in the
actual gain on plan assets. Outside the U.S., in general, we fund our defined benefit plans to the extent that tax or other incentives exist.
(d) The funded status of our postretirement plans is largely unchanged as changes in actuarial assumptions were offset by the actual return on plan assets and
increased contributions.
(e) For the U.S. and international pension plans, the benefit obligation is the projected benefit obligation. For the postretirement plans, the benefit obligation is the
accumulated postretirement benefit obligation (ABO). The ABO for all of our U.S. qualified pension plans was $15.9 billion in 2012 and $13.8 billion in 2011. The
ABO for our U.S. supplemental (non-qualified) pension plans was $1.5 billion in 2012 and $1.2 billion 2011. The ABO for our international pension plans was
$9.4 billion in 2012 and $8.3 billion in 2011.