Pfizer 2012 Annual Report Download - page 119
Download and view the complete annual report
Please find page 119 of the 2012 Pfizer annual report below. You can navigate through the pages in the report by either clicking on the pages listed below, or by using the keyword search tool below to find specific information within the annual report.-
 1
1 -
2
-
3
-
4
-
5
-
6
-
7
-
8
-
9
-
10
-
11
-
12
-
13
-
14
-
15
-
16
-
17
-
18
-
19
-
20
-
21
-
22
-
23
-
24
-
25
-
26
-
27
-
28
-
29
-
30
-
31
-
32
-
33
-
34
-
35
-
36
-
37
-
38
-
39
-
40
-
41
-
42
-
43
-
44
-
45
-
46
-
47
-
48
-
49
-
50
-
51
-
52
-
53
-
54
-
55
-
56
-
57
-
58
-
59
-
60
-
61
-
62
-
63
-
64
-
65
-
66
-
67
-
68
-
69
-
70
-
71
-
72
-
73
-
74
-
75
-
76
-
77
-
78
-
79
-
80
-
81
-
82
-
83
-
84
-
85
-
86
-
87
-
88
-
89
-
90
-
91
-
92
-
93
-
94
-
95
-
96
-
97
-
98
-
99
-
100
-
101
-
102
-
103
-
104
-
105
-
106
-
107
-
108
-
 109
109 -
 110
110 -
 111
111 -
 112
112 -
 113
113 -
 114
114 -
 115
115 -
 116
116 -
 117
117 -
 118
118 -
 119
119 -
 120
120 -
 121
121
 |
 |

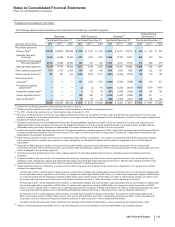
Quarterly Consolidated Financial Data (Unaudited)
Pfizer Inc. and Subsidiary Companies
118
2012 Financial Report
Quarter
(MILLIONS OF DOLLARS, EXCEPT PER COMMON SHARE DATA) First Second Third Fourth
2011
Revenues $16,024 $16,485 $16,609 $16,141
Costs and expenses(a) 12,124 12,409 11,978 13,514
Restructuring charges and certain acquisition-related costs(b) 890 478 1,090 472
Income from continuing operations before provision for taxes on income 3,010 3,598 3,541 2,155
Provision for taxes on income(c) 874 1,077 1,216 742
Income from continuing operations 2,136 2,521 2,325 1,413
Discontinued operations—net of tax 98 97 1,424 35
Net income before allocation to noncontrolling interests 2,234 2,618 3,749 1,448
Less: Net income attributable to noncontrolling interests 12 8 11 9
Net income attributable to Pfizer Inc. $ 2,222 $2,610 $3,738 $1,439
Earnings per common share—basic:
Income from continuing operations attributable to Pfizer Inc. common
shareholders $ 0.27 $0.32 $0.30 $0.18
Discontinued operations—net of tax 0.01 0.01 0.19 —
Net income attributable to Pfizer Inc. common shareholders $ 0.28 $0.33 $0.48 $0.19
Earnings per common share—diluted:
Income from continuing operations attributable to Pfizer Inc. common
shareholders $ 0.26 $0.32 $0.30 $0.18
Discontinued operations—net of tax 0.01 0.01 0.18 —
Net income attributable to Pfizer Inc. common shareholders $ 0.28 $0.33 $0.48 $0.19
Cash dividends paid per common share $ 0.20 $0.20 $0.20 $0.20
Stock prices
High $20.57 $21.45 $20.95 $21.90
Low $17.62 $19.10 $16.63 $17.05
(a) The fourth quarter of 2011 reflects historically higher Q4 costs in Cost of sales and Selling, informational and administrative expenses,Research and
development expenses and Other deductions—net.
(b) The third quarter of 2011 reflects higher employee termination costs.
(c) The third quarter of 2011 reflects the gain on the sale of Capsugel.
Basic and diluted EPS are computed independently for each of the periods presented. Accordingly, the sum of the quarterly EPS amounts may
not agree to the total for the year.