Pfizer 2012 Annual Report Download - page 93
Download and view the complete annual report
Please find page 93 of the 2012 Pfizer annual report below. You can navigate through the pages in the report by either clicking on the pages listed below, or by using the keyword search tool below to find specific information within the annual report.-
 1
1 -
2
-
3
-
4
-
5
-
6
-
7
-
8
-
9
-
10
-
11
-
12
-
13
-
14
-
15
-
16
-
17
-
18
-
19
-
20
-
21
-
22
-
23
-
24
-
25
-
26
-
27
-
28
-
29
-
30
-
31
-
32
-
33
-
34
-
35
-
36
-
37
-
38
-
39
-
40
-
41
-
42
-
43
-
44
-
45
-
46
-
47
-
48
-
49
-
50
-
51
-
52
-
53
-
54
-
55
-
56
-
57
-
58
-
59
-
60
-
61
-
62
-
63
-
64
-
65
-
66
-
67
-
68
-
69
-
70
-
71
-
72
-
73
-
74
-
75
-
76
-
77
-
78
-
79
-
80
-
81
-
82
-
 83
83 -
 84
84 -
 85
85 -
 86
86 -
 87
87 -
 88
88 -
 89
89 -
 90
90 -
 91
91 -
 92
92 -
 93
93 -
 94
94 -
 95
95 -
 96
96 -
 97
97 -
 98
98 -
 99
99 -
 100
100 -
 101
101 -
 102
102 -
 103
103 -
104
-
105
-
106
-
107
-
108
-
109
-
110
-
111
-
112
-
113
-
114
-
115
-
116
-
117
-
118
-
119
-
120
-
121
 |
 |

Notes to Consolidated Financial Statements
Pfizer Inc. and Subsidiary Companies
92
2012 Financial Report
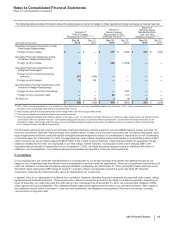
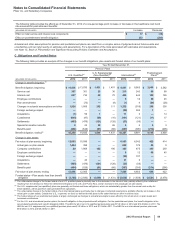
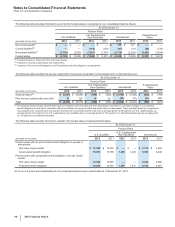
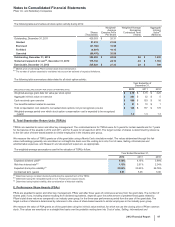
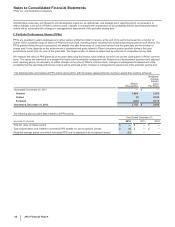
(b) Reflects postretirement plan assets, which support a portion of our U.S. retiree medical plans.
The following table provides an analysis of the changes in our more significant investments valued using significant unobservable inputs:
Year Ended December 31,
U.S. Qualified Pension Plans International Pension Plans
Private Equity Funds Other Insurance Contracts Other
(MILLIONS OF DOLLARS) 2012 2011 2012 2011 2012 2011 2012 2011
Fair value, beginning $920$899$656 $465 $366 $366 $348 $214
Actual return on plan assets:
Assets held, ending 4(246)61 24 88(14)(4)
Assets sold during the period —55 —(6) ——5—
Purchases, sales and
settlements, net (58) 212 40 173 (5) (12)50 120
Transfer into/(out of) Level 3 ————(5) (15)—12
Exchange rate changes ————(16)19 —6
Fair value, ending $ 866 $ 920 $757 $656 $348 $366 $389 $348
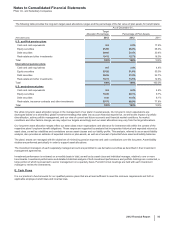
A single estimate of fair value can result from a complex series of judgments about future events and uncertainties and can rely heavily on
estimates and assumptions. For a description of our general accounting policies associated with developing fair value estimates, see Note 1E.
Basis of Presentation and Significant Accounting Policies: Fair Value. For a description of the risks associated with estimates and
assumptions, see Note 1C. Basis of Presentation and Significant Accounting Policies: Estimates and Assumptions.
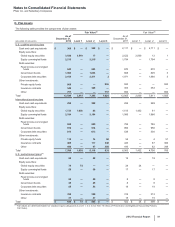
Specifically, the following methods and assumptions were used to estimate the fair value of our pension and postretirement plans’ assets:
• Cash and cash equivalents, Equity commingled funds, Fixed-income commingled funds––observable prices.
• Global equity securities—quoted market prices.
• Government bonds, Corporate debt securities—observable market prices.
• Other investments—principally unobservable inputs that are significant to the estimation of fair value. These unobservable inputs could
include, for example, the investment managers’ assumptions about earnings multiples and future cash flows.
We periodically review the methodologies, inputs and outputs of third-party pricing services for reasonableness.