Pfizer 2012 Annual Report Download - page 57
Download and view the complete annual report
Please find page 57 of the 2012 Pfizer annual report below. You can navigate through the pages in the report by either clicking on the pages listed below, or by using the keyword search tool below to find specific information within the annual report.-
 1
1 -
2
-
3
-
4
-
5
-
6
-
7
-
8
-
9
-
10
-
11
-
12
-
13
-
14
-
15
-
16
-
17
-
18
-
19
-
20
-
21
-
22
-
23
-
24
-
25
-
26
-
27
-
28
-
29
-
30
-
31
-
32
-
33
-
34
-
35
-
36
-
37
-
38
-
39
-
40
-
41
-
42
-
43
-
44
-
45
-
46
-
 47
47 -
 48
48 -
 49
49 -
 50
50 -
 51
51 -
 52
52 -
 53
53 -
 54
54 -
 55
55 -
 56
56 -
 57
57 -
 58
58 -
 59
59 -
 60
60 -
 61
61 -
 62
62 -
 63
63 -
 64
64 -
 65
65 -
 66
66 -
 67
67 -
68
-
69
-
70
-
71
-
72
-
73
-
74
-
75
-
76
-
77
-
78
-
79
-
80
-
81
-
82
-
83
-
84
-
85
-
86
-
87
-
88
-
89
-
90
-
91
-
92
-
93
-
94
-
95
-
96
-
97
-
98
-
99
-
100
-
101
-
102
-
103
-
104
-
105
-
106
-
107
-
108
-
109
-
110
-
111
-
112
-
113
-
114
-
115
-
116
-
117
-
118
-
119
-
120
-
121
 |
 |

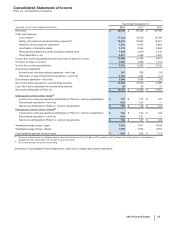
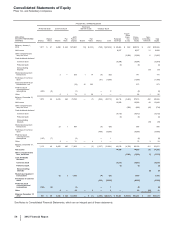
Consolidated Statements of Equity
Pfizer Inc. and Subsidiary Companies
56
2012 Financial Report
PFIZER INC. SHAREHOLDERS
Preferred Stock Common Stock
Employee
Benefit Trusts Treasury Stock
(MILLIONS,
EXCEPT PREFERRED
SHARES) Shares
Stated
Value Shares
Par
Value
Add’l
Paid-In
Capital Shares
Fair
Value Shares Cost
Retained
Earnings
Accum.
Other
Comp.
Inc./
(Loss)
Share -
holders’
Equity
Non-
controlling
Interests
Tota l
Equity
Balance, January 1,
2010 1,511 $ 61 8,869 $ 443 $70,497 (19) $ (333) (799) $(21,632) $ 40,426 $ 552 $90,014 $ 432 $90,446
Net income 8,257 8,257 31 8,288
Other comprehensive
loss, net of tax (3,992) (3,992) 5 (3,987)
Cash dividends declared:
Common stock (5,964) (5,964) (5,964)
Preferred stock (3) (3) (3)
Noncontrolling
interests (17) (17)
Share-based payment
transactions 2 — 209 1 14 (5) (82) 141 141
Purchases of common
stock (61) (1,000) (1,000) (1,000)
Employee benefit trust
transactions—net (19) 16 292 273 273
Preferred stock
conversions and
redemptions (232) (9) (1) — 2 (8) (8)
Other 5 1 74 2 20 1 — — 95 1 96
Balance, December 31,
2010 1,279 52 8,876 444 70,760 — (7) (864) (22,712) 42,716 (3,440) 87,813 452 88,265
Net income 10,009 10,009 40 10,049
Other comprehensive
loss, net of tax (689) (689) (45) (734)
Cash dividends declared:
Common stock (6,512) (6,512) (6,512)
Preferred stock (3) (3) (3)
Noncontrolling
interests (19) (19)
Share-based payment
transactions 23 1 594 (5) (90) 505 505
Purchases of common
stock (459) (9,000) (9,000) (9,000)
Preferred stock
conversions and
redemptions (167) (7) (2) — 1 (8) (8)
Other 3 — 71 — 4 1 — — 75 3 78
Balance, December 31,
2011 1,112 45 8,902 445 71,423 — (3) (1,327) (31,801) 46,210 (4,129) 82,190 431 82,621
Net income 14,570 14,570 28 14,598
Other comprehensive
loss, net of tax (1,824) (1,824) (7) (1,831)
Cash dividends
declared:
Common stock (6,537) (6,537) (6,537)
Preferred stock (3) (3) (3)
Noncontrolling
interests (9) (9)
Share-based payment
transactions 52 3 1,150 (4) (97) 1,056 1,056
Purchases of common
stock (349) (8,228) (8,228) (8,228)
Preferred stock
conversions and
redemptions (145) (6) (3) — 1 (8) (8)
Other 2 — 38 — 2 — 4 — 44 (25) 19
Balance, December 31,
2012 967 $ 39 8,956 $ 448 $72,608 — $ (1) (1,680) $(40,121) $ 54,240 $ (5,953) $81,260 $ 418 $81,678
See Notes to Consolidated Financial Statements, which are an integral part of these statements.