Pfizer 2012 Annual Report Download - page 115
Download and view the complete annual report
Please find page 115 of the 2012 Pfizer annual report below. You can navigate through the pages in the report by either clicking on the pages listed below, or by using the keyword search tool below to find specific information within the annual report.-
 1
1 -
2
-
3
-
4
-
5
-
6
-
7
-
8
-
9
-
10
-
11
-
12
-
13
-
14
-
15
-
16
-
17
-
18
-
19
-
20
-
21
-
22
-
23
-
24
-
25
-
26
-
27
-
28
-
29
-
30
-
31
-
32
-
33
-
34
-
35
-
36
-
37
-
38
-
39
-
40
-
41
-
42
-
43
-
44
-
45
-
46
-
47
-
48
-
49
-
50
-
51
-
52
-
53
-
54
-
55
-
56
-
57
-
58
-
59
-
60
-
61
-
62
-
63
-
64
-
65
-
66
-
67
-
68
-
69
-
70
-
71
-
72
-
73
-
74
-
75
-
76
-
77
-
78
-
79
-
80
-
81
-
82
-
83
-
84
-
85
-
86
-
87
-
88
-
89
-
90
-
91
-
92
-
93
-
94
-
95
-
96
-
97
-
98
-
99
-
100
-
101
-
102
-
103
-
104
-
 105
105 -
 106
106 -
 107
107 -
 108
108 -
 109
109 -
 110
110 -
 111
111 -
 112
112 -
 113
113 -
 114
114 -
 115
115 -
 116
116 -
 117
117 -
 118
118 -
 119
119 -
 120
120 -
 121
121
 |
 |

Notes to Consolidated Financial Statements
Pfizer Inc. and Subsidiary Companies
114
2012 Financial Report
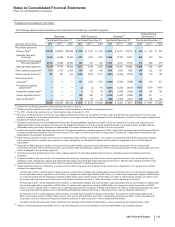
B. Geographic Information
Revenues exceeded $500 million in each of 16 countries outside the U.S. in 2012 and 2011, and in each of 17 countries outside the U.S. in
2010. The U.S. and Japan were the only countries to contribute more than 10% of total revenue in 2012. The U.S. was the only country to
contribute more than 10% of total revenue in 2011 and 2010.
The following table provides revenues by geographic area:
Year Ended December 31,
(MILLIONS OF DOLLARS) 2012 2011(a) 2010
Revenues
United States $23,086 $26,933 $28,855
Developed Europe(b) 13,375 16,099 16,156
Developed Rest of World(c) 10,554 10,975 9,891
Emerging Markets(d) 11,971 11,252 10,263
Revenues $58,986 $65,259 $65,165
(a) For 2011, includes King commencing on the acquisition date of January 31, 2011.
(b) Developed Europe region includes the following markets: Western Europe, Finland and the Scandinavian countries. Revenues denominated in euros were $10
billion, $12 billion and $12 billion for 2012, 2011 and 2010, respectively.
(c) Developed Rest of World region includes the following markets: Australia, Canada, Japan, New Zealand and South Korea.
(d) Emerging Markets region includes, but is not limited to, the following markets: Asia (excluding Japan and South Korea), Latin America, the Middle East, Eastern
Europe, Africa, Turkey and Central Europe.
Long-lived assets by geographic region follow:
As of December 31,
(MILLIONS OF DOLLARS) 2012 2011 2010
Property, plant and equipment, net
United States $7,262 $7,893 $8,508
Developed Europe(a) 5,121 5,866 7,000
Developed Rest of World(b) 847 903 853
Emerging Markets(c) 1,231 1,259 1,246
Property, plant and equipment, net $14,461 $15,921 $17,607
(a) Developed Europe region includes the following markets: Western Europe, Finland and the Scandinavian countries.
(b) Developed Rest of World region includes the following markets: Australia, Canada, Japan, New Zealand, and South Korea.
(c) Emerging Markets region includes, but is not limited to, the following markets: Asia (excluding Japan and South Korea), Latin America, Middle East, Africa,
Central and Eastern Europe and Turkey.
C. Other Revenue Information
Significant Customers
We sell our products primarily to customers in the wholesale sector. In 2012, sales to our three largest U.S. wholesaler customers represented
approximately 12%, 9% and 7% of total revenues and, collectively, represented approximately 16% of total accounts receivable as of
December 31, 2012. In 2011, sales to our three largest U.S. wholesaler customers represented approximately 13%, 11% and 9% of total
revenues and, collectively, represented approximately 14% of total accounts receivable as of December 31, 2011. For both years, these sales
and related accounts receivable were concentrated in our three biopharmaceutical operating segments.