Pfizer 2012 Annual Report Download - page 12
Download and view the complete annual report
Please find page 12 of the 2012 Pfizer annual report below. You can navigate through the pages in the report by either clicking on the pages listed below, or by using the keyword search tool below to find specific information within the annual report.-
 1
1 -
 2
2 -
 3
3 -
 4
4 -
 5
5 -
 6
6 -
 7
7 -
 8
8 -
 9
9 -
 10
10 -
 11
11 -
 12
12 -
 13
13 -
 14
14 -
 15
15 -
 16
16 -
 17
17 -
 18
18 -
 19
19 -
 20
20 -
 21
21 -
 22
22 -
23
-
24
-
25
-
26
-
27
-
28
-
29
-
30
-
31
-
32
-
33
-
34
-
35
-
36
-
37
-
38
-
39
-
40
-
41
-
42
-
43
-
44
-
45
-
46
-
47
-
48
-
49
-
50
-
51
-
52
-
53
-
54
-
55
-
56
-
57
-
58
-
59
-
60
-
61
-
62
-
63
-
64
-
65
-
66
-
67
-
68
-
69
-
70
-
71
-
72
-
73
-
74
-
75
-
76
-
77
-
78
-
79
-
80
-
81
-
82
-
83
-
84
-
85
-
86
-
87
-
88
-
89
-
90
-
91
-
92
-
93
-
94
-
95
-
96
-
97
-
98
-
99
-
100
-
101
-
102
-
103
-
104
-
105
-
106
-
107
-
108
-
109
-
110
-
111
-
112
-
113
-
114
-
115
-
116
-
117
-
118
-
119
-
120
-
121
 |
 |

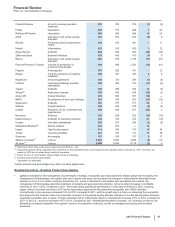
Financial Review
Pfizer Inc. and Subsidiary Companies
2012 Financial Report
11
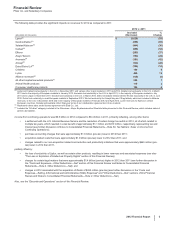
For a discussion about the application of Fair Value to our benefit plan assets, see Notes to Consolidated Financial Statements––Note 11D.
Pension and Postretirement Benefit Plans and Defined Contribution Plans: Plan Assets.
For a discussion about the application of Fair Value to our asset impairment reviews, see “Asset Impairment Reviews” below.
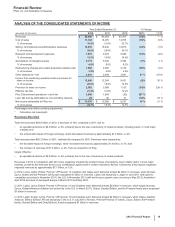
Revenues
As is typical in the biopharmaceutical industry, our gross product sales are subject to a variety of deductions that are generally estimated and
recorded in the same period that the revenues are recognized and primarily represent rebates and discounts to government agencies,
wholesalers, distributors and managed care organizations with respect to our biopharmaceutical products. See also Notes to Consolidated
Financial Statements––Note 1G. Basis of Presentation and Significant Accounting Policies: Revenues for a detailed description of the nature
of our sales deductions and our procedures for estimating our obligations. For example,
• For Medicaid, Medicare and performance-based contract rebates, we use experience ratios, which may be adjusted to better match our
current experience or our expected future experience.
• For contractual or legislatively mandated deductions outside the U.S., we use estimated allocation factors, based on historical payments
and some third-party reports, to project the expected level of reimbursement.
• For chargebacks, we closely approximate actual as we settle these deductions generally within two to five weeks after incurring the
liability.
• For sales returns, we perform calculations in each market that incorporate the following, as appropriate: local returns policies and
practices; returns as a percentage of sales; an understanding of the reasons for past returns; estimated shelf life by product; an estimate
of the amount of time between shipment and return or lag time; and any other factors that could impact the estimate of future returns,
such as loss of exclusivity, product recalls or a changing competitive environment.
• For sales incentives, we use our historical experience with similar incentives programs to predict customer behavior.
If any of our ratios, factors, assessments, experiences or judgments are not indicative or accurate predictors of our future experience, our
results could be materially affected. Although the amounts recorded for these sales deductions are heavily dependent on estimates and
assumptions, historically, our adjustments to actual have not been material; on a quarterly basis, they generally have been less than 1.0% of
biopharmaceutical net sales and can result in a net increase to income or a net decrease to income. The sensitivity of our estimates can vary
by program, type of customer and geographic location. However, estimates associated with U.S. Medicaid and performance-based contract
rebates are most at-risk for material adjustment because of the extensive time delay between the recording of the accrual and its ultimate
settlement, an interval that can generally range up to one year. Because of this time lag, in any given quarter, our adjustments to actual can
incorporate revisions of several prior quarters.
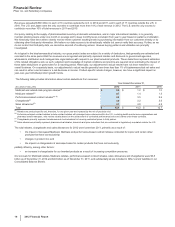
Asset Impairment Reviews
We review all of our long-lived assets, including goodwill and other intangible assets, for impairment indicators throughout the year and we
perform impairment testing for goodwill and indefinite-lived assets annually and for all other long-lived assets whenever impairment indicators
are present. When necessary, we record charges for impairments of long-lived assets for the amount by which the fair value is less than the
carrying value of these assets. Our impairment review processes are described in the Notes to Consolidated Financial Statements––Note 1K.
Basis of Presentation and Significant Accounting Policies: Amortization of Intangible Assets, Depreciation and Certain Long-Lived Assets .
Examples of events or circumstances that may be indicative of impairment include:
• A significant adverse change in legal factors or in the business climate that could affect the value of the asset. For example, a successful
challenge of our patent rights would likely result in generic competition earlier than expected.
• A significant adverse change in the extent or manner in which an asset is used. For example, restrictions imposed by the FDA or other
regulatory authorities could affect our ability to manufacture or sell a product.
• A projection or forecast that demonstrates losses or reduced profits associated with an asset. This could result, for example, from a
change in a government reimbursement program that results in an inability to sustain projected product revenues and profitability. This
also could result from the introduction of a competitor’s product that results in a significant loss of market share or the inability to achieve
the previously projected revenue growth, as well as the lack of acceptance of a product by patients, physicians and payers. For in-
process research and development (IPR&D) projects, this could result from, among other things, a change in outlook based on clinical
trial data, a delay in the projected launch date or additional expenditures to commercialize the product.
Intangible Assets Other than Goodwill
As a result of our intangible asset impairment review work, we recognized a number of impairments of intangible assets other than goodwill.
We recorded the following intangible asset impairment charges in Other deductions––net:
• In 2012, $872 million, reflecting (i) $393 million of IPR&D assets, primarily related to compounds that targeted autoimmune and
inflammatory diseases (full write-off) and, to a lesser extent, compounds related to pain treatment; (ii) $175 million related to our
Consumer Healthcare indefinite-lived brand assets, primarily Robitussin, a cough suppressant; (iii) $279 million related to Developed
Technology Rights, a charge comprised of impairments of various products, none of which individually exceeded $45 million; and (iv) $25
million of finite-lived brands. The intangible asset impairment charges for 2012 reflect, among other things, the impact of new scientific