Pfizer 2012 Annual Report Download - page 80
Download and view the complete annual report
Please find page 80 of the 2012 Pfizer annual report below. You can navigate through the pages in the report by either clicking on the pages listed below, or by using the keyword search tool below to find specific information within the annual report.-
 1
1 -
2
-
3
-
4
-
5
-
6
-
7
-
8
-
9
-
10
-
11
-
12
-
13
-
14
-
15
-
16
-
17
-
18
-
19
-
20
-
21
-
22
-
23
-
24
-
25
-
26
-
27
-
28
-
29
-
30
-
31
-
32
-
33
-
34
-
35
-
36
-
37
-
38
-
39
-
40
-
41
-
42
-
43
-
44
-
45
-
46
-
47
-
48
-
49
-
50
-
51
-
52
-
53
-
54
-
55
-
56
-
57
-
58
-
59
-
60
-
61
-
62
-
63
-
64
-
65
-
66
-
67
-
68
-
69
-
 70
70 -
 71
71 -
 72
72 -
 73
73 -
 74
74 -
 75
75 -
 76
76 -
 77
77 -
 78
78 -
 79
79 -
 80
80 -
 81
81 -
 82
82 -
 83
83 -
 84
84 -
 85
85 -
 86
86 -
 87
87 -
 88
88 -
 89
89 -
 90
90 -
91
-
92
-
93
-
94
-
95
-
96
-
97
-
98
-
99
-
100
-
101
-
102
-
103
-
104
-
105
-
106
-
107
-
108
-
109
-
110
-
111
-
112
-
113
-
114
-
115
-
116
-
117
-
118
-
119
-
120
-
121
 |
 |

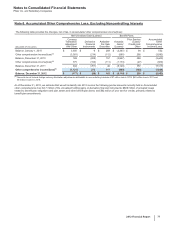
Notes to Consolidated Financial Statements
Pfizer Inc. and Subsidiary Companies
2012 Financial Report
79
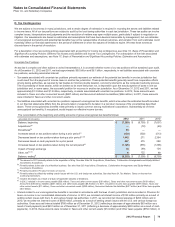
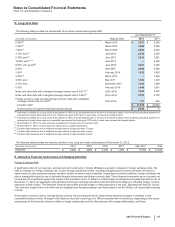
(k) The fair value of our long-term debt (not including the current portion of long-term debt) is $37.5 billion as of December 31, 2012 and $40.1 billion as of
December 31, 2011. The fair value measurements for our long-term debt are based on Level 2 inputs, using a market approach.
A single estimate of fair value can result from a complex series of judgments about future events and uncertainties and can rely heavily on
estimates and assumptions. For a description of our general accounting policies associated with developing fair value estimates, see Note 1E.
Basis of Presentation and Significant Accounting Policies: Fair Value. For a description of the risks associated with estimates and
assumptions, see Note 1C. Basis of Presentation and Significant Accounting Policies: Estimates and Assumptions.
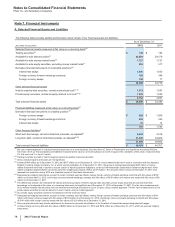
The following methods and assumptions were used to estimate the fair value of our financial assets and liabilities:
• Trading equity securities—quoted market prices.
• Trading debt securities—observable market interest rates.
• Available-for-sale debt securities—third-party matrix-pricing model that uses significant inputs derived from or corroborated by observable
market data and credit-adjusted interest rate yield curves.
• Available-for-sale money market funds—observable Net Asset Value prices.
• Available-for-sale equity securities, excluding money market funds—third-party pricing services that principally use a composite of
observable prices.
• Derivative financial instruments (assets and liabilities)—third-party matrix-pricing model that uses significant inputs derived from or
corroborated by observable market data. Where applicable, these models discount future cash flow amounts using market-based
observable inputs, including interest rate yield curves, and forward and spot prices for currencies. The credit risk impact to our derivative
financial instruments was not significant.
• Held-to-maturity debt securities—third-party matrix-pricing model that uses significant inputs derived from or corroborated by observable
market data and credit-adjusted interest rate yield curves.
• Private equity securities, excluding equity-method investments—application of the implied volatility associated with an observable biotech
index to the carrying amount of our portfolio.
• Short-term borrowings and long-term debt—third-party matrix-pricing model that uses significant inputs derived from or corroborated by
observable market data and our own credit rating.
We periodically review the methodologies, inputs and outputs of third-party pricing services for reasonableness. Our procedures can include,
for example, referencing other third-party pricing models, monitoring key observable inputs (like LIBOR interest rates) and selectively
performing test-comparisons of values with actual sales of financial instruments.
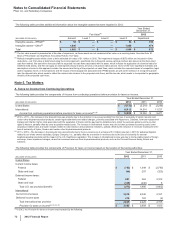
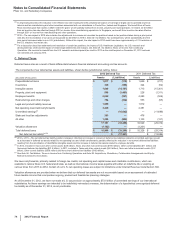
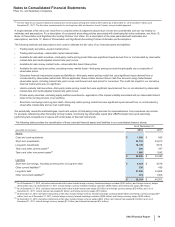
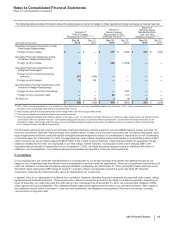
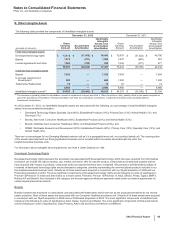
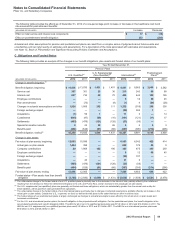
The following table provides the classification of these selected financial assets and liabilities in our consolidated balance sheets:
As of December 31,
(MILLIONS OF DOLLARS) 2012 2011
Assets
Cash and cash equivalents $1,000 $900
Short-term investments 22,319 23,270
Long-term investments 14,149 9,814
Taxes and other current assets(a) 296 357
Taxes and other noncurrent assets(b) 1,086 1,042
$38,850 $35,383
Liabilities
Short-term borrowings, including current portion of long-term debt $6,424 $4,016
Other current liabilities(c) 330 459
Long-term debt 31,036 34,926
Other noncurrent liabilities(d) 374 1,306
$38,164 $40,707
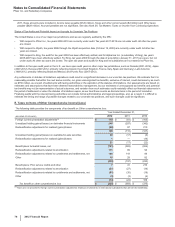
(a) As of December 31, 2012, derivative instruments at fair value include foreign currency forward-exchange contracts ($152 million) and foreign currency swaps
($144 million) and, as of December 31, 2011, include foreign currency forward-exchange contracts ($349 million) and interest rate swaps ($8 million).
(b) As of December 31, 2012, derivative instruments at fair value include interest rate swaps ($1 billion) and foreign currency swaps ($50 million) and, as of
December 31, 2011, include interest rate swaps ($1 billion) and foreign currency swaps ($17 million).
(c) At December 31, 2012, derivative instruments at fair value include foreign currency forward-exchange contracts ($243 million) and foreign currency swaps ($87
million) and, as of December 31, 2011, include foreign currency forward-exchange contracts ($355 million) and foreign currency swaps ($104 million).
(d) At December 31, 2012, derivative instruments at fair value include foreign currency swaps ($341 million) and interest rate swaps ($33 million) and, as of
December 31, 2011, include foreign currency swaps ($1.3 billion) and interest rate swaps ($14 million).