Pfizer 2012 Annual Report Download - page 75
Download and view the complete annual report
Please find page 75 of the 2012 Pfizer annual report below. You can navigate through the pages in the report by either clicking on the pages listed below, or by using the keyword search tool below to find specific information within the annual report.-
 1
1 -
2
-
3
-
4
-
5
-
6
-
7
-
8
-
9
-
10
-
11
-
12
-
13
-
14
-
15
-
16
-
17
-
18
-
19
-
20
-
21
-
22
-
23
-
24
-
25
-
26
-
27
-
28
-
29
-
30
-
31
-
32
-
33
-
34
-
35
-
36
-
37
-
38
-
39
-
40
-
41
-
42
-
43
-
44
-
45
-
46
-
47
-
48
-
49
-
50
-
51
-
52
-
53
-
54
-
55
-
56
-
57
-
58
-
59
-
60
-
61
-
62
-
63
-
64
-
 65
65 -
 66
66 -
 67
67 -
 68
68 -
 69
69 -
 70
70 -
 71
71 -
 72
72 -
 73
73 -
 74
74 -
 75
75 -
 76
76 -
 77
77 -
 78
78 -
 79
79 -
 80
80 -
 81
81 -
 82
82 -
 83
83 -
 84
84 -
 85
85 -
86
-
87
-
88
-
89
-
90
-
91
-
92
-
93
-
94
-
95
-
96
-
97
-
98
-
99
-
100
-
101
-
102
-
103
-
104
-
105
-
106
-
107
-
108
-
109
-
110
-
111
-
112
-
113
-
114
-
115
-
116
-
117
-
118
-
119
-
120
-
121
 |
 |

Notes to Consolidated Financial Statements
Pfizer Inc. and Subsidiary Companies
74
2012 Financial Report
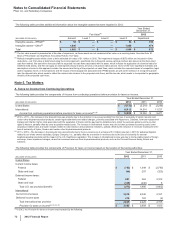
(b) In all periods presented, the reduction in the effective tax rate resulting from the jurisdictional location of earnings is largely due to generally lower tax
rates as well as manufacturing and other incentives associated with our subsidiaries in Puerto Rico, Ireland and Singapore. We benefit from a Puerto
Rican incentive grant that expires in 2029. Under the grant, we are partially exempt from income, property and municipal taxes. In Ireland, we benefited
from an incentive tax rate effective through 2010 on income from manufacturing operations. In Singapore, we benefit from incentive tax rates effective
through 2031 on income from manufacturing and other operations.
(c) 2010––The rate impact in 2010 also includes the adjustments to increase our uncertain tax positions based on tax positions taken during a prior period
(see also the reconciliation of our gross unrecognized tax benefits for 2010 in Note 5D. Tax Matters: Tax Contingencies, where substantially all of the
prior period increases relate to non-U.S. jurisdictions). Without this impact, the rate impact in 2010 would have been approximately a 2.1% reduction of
the U.S. statutory income tax rate.
(d) For a discussion about tax settlements and resolution of certain tax positions, the impact of U.S. Healthcare Legislation, the U.S. research and
development tax credit and the impact of certain legal settlements and charges, see Note 5A. Tax Matters: Taxes on Income from Continuing
Operations. We received no benefit from the U.S. research and development tax credit in 2012 as the credit expired on December 31, 2011 and was
not extended until January 2013.
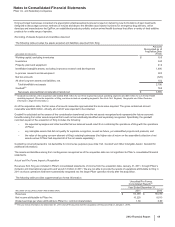
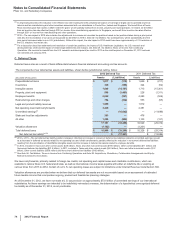
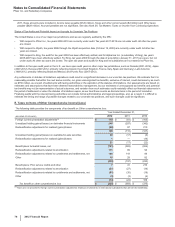
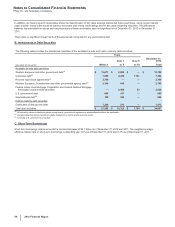
C. Deferred Taxes
Deferred taxes arise as a result of basis differentials between financial statement accounting and tax amounts.
The components of our deferred tax assets and liabilities, shown before jurisdictional netting, follow:
2012 Deferred Tax 2011 Deferred Tax
(MILLIONS OF DOLLARS) Assets (Liabilities) Assets (Liabilities)
Prepaid/deferred items $1,817 $(119)$1,659 $(211)
Inventories 330 (198)324 (52)
Intangible assets 1,649 (14,187) 1,713 (15,301)
Property, plant and equipment 508 (1,485) 226 (1,311)
Employee benefits 5,042 (391)4,280 (524)
Restructurings and other charges 784 (334)553 (95)
Legal and product liability reserves 1,888 —1,812 —
Net operating loss/credit carryforwards 3,439 —4,381 —
Unremitted earnings(c) — (16,042) — (11,699)
State and local tax adjustments 385 —476 —
All other 1,259 (504)1,105 (121)
17,101 (33,260) 16,529 (29,314)
Valuation allowances (1,102) — (1,201)—
Total deferred taxes $15,999 $ (33,260) $15,328 $(29,314)
Net deferred tax liability(a), (b) $ (17,261) $(13,986)
(a) 2012 v. 2011––The net deferred tax liability position increased, reflecting an increase in noncurrent deferred tax liabilities related to unremitted earnings, as well
as a decrease in deferred tax assets related to net operating loss and credit carryforwards, partially offset by the reduction in noncurrent deferred tax liabilities
resulting from the amortization of identifiable intangible assets and the increase in deferred tax assets related to employee benefits.
(b) In 2012, included in Taxes and other current assets ($3.6 billion), Taxes and other noncurrent assets ($700 million), Other current liabilities ($11 million) and
Noncurrent deferred tax liabilities ($21.6 billion). In 2011, included in Taxes and other current assets ($4.0 billion), Taxes and other noncurrent assets ($1.2
billion), Other current liabilities ($350 million) and Noncurrent deferred tax liabilities ($18.9 billion).
(c) See Note 5A. Tax Matters: Taxes on Income from Continuing Operations and Note 2B. Acquisitions, Divestitures, Collaborative Arrangements and Equity-
Method Investments: Divestitures.
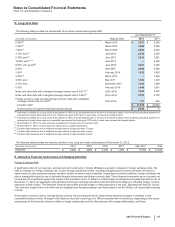
We have carryforwards, primarily related to foreign tax credits, net operating and capital losses and charitable contributions, which are
available to reduce future U.S. federal and state, as well as international, income taxes payable with either an indefinite life or expiring at
various times from 2013 to 2032. Certain of our U.S. net operating losses are subject to limitations under Internal Revenue Code Section 382.
Valuation allowances are provided when we believe that our deferred tax assets are not recoverable based on an assessment of estimated
future taxable income that incorporates ongoing, prudent and feasible tax planning strategies.
As of December 31, 2012, we have not made a U.S. tax provision on approximately $73.0 billion of unremitted earnings of our international
subsidiaries. As these earnings are intended to be indefinitely reinvested overseas, the determination of a hypothetical unrecognized deferred
tax liability as of December 31, 2012, is not practicable.