Pfizer 2012 Annual Report Download - page 85
Download and view the complete annual report
Please find page 85 of the 2012 Pfizer annual report below. You can navigate through the pages in the report by either clicking on the pages listed below, or by using the keyword search tool below to find specific information within the annual report.-
 1
1 -
2
-
3
-
4
-
5
-
6
-
7
-
8
-
9
-
10
-
11
-
12
-
13
-
14
-
15
-
16
-
17
-
18
-
19
-
20
-
21
-
22
-
23
-
24
-
25
-
26
-
27
-
28
-
29
-
30
-
31
-
32
-
33
-
34
-
35
-
36
-
37
-
38
-
39
-
40
-
41
-
42
-
43
-
44
-
45
-
46
-
47
-
48
-
49
-
50
-
51
-
52
-
53
-
54
-
55
-
56
-
57
-
58
-
59
-
60
-
61
-
62
-
63
-
64
-
65
-
66
-
67
-
68
-
69
-
70
-
71
-
72
-
73
-
74
-
 75
75 -
 76
76 -
 77
77 -
 78
78 -
 79
79 -
 80
80 -
 81
81 -
 82
82 -
 83
83 -
 84
84 -
 85
85 -
 86
86 -
 87
87 -
 88
88 -
 89
89 -
 90
90 -
 91
91 -
 92
92 -
 93
93 -
 94
94 -
 95
95 -
96
-
97
-
98
-
99
-
100
-
101
-
102
-
103
-
104
-
105
-
106
-
107
-
108
-
109
-
110
-
111
-
112
-
113
-
114
-
115
-
116
-
117
-
118
-
119
-
120
-
121
 |
 |

Notes to Consolidated Financial Statements
Pfizer Inc. and Subsidiary Companies
84
2012 Financial Report
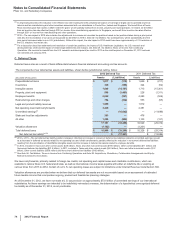
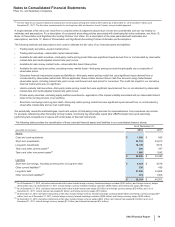
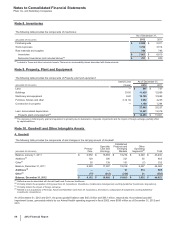
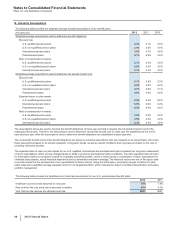
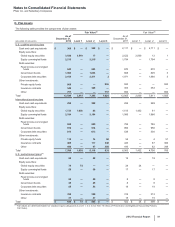
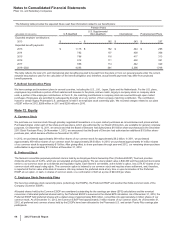
Note 8. Inventories
The following table provides the components of Inventories:
As of December 31,
(MILLIONS OF DOLLARS) 2012 2011
Finished goods $2,529 $2,311
Work-in-process 3,794 3,514
Raw materials and supplies 740 785
Inventories $7,063 $6,610
Noncurrent inventories (not included above)(a) $761 $800
(a) Included in Taxes and other noncurrent assets. There are no recoverability issues associated with these amounts.
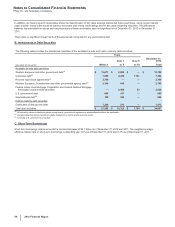
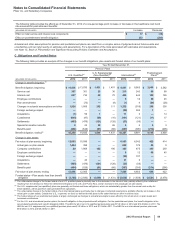
Note 9. Property, Plant and Equipment
The following table provides the components of Property, plant and equipment:
Useful Lives As of December 31,
(MILLIONS OF DOLLARS) (Years) 2012 2011
Land —$597 $737
Buildings 33-50 11,420 12,089
Machinery and equipment 8-20 10,795 10,882
Furniture, fixtures and other 3-12 1/2 3,962 4,235
Construction in progress —1,108 1,294
27,882 29,237
Less: Accumulated depreciation 13,421 13,316
Property, plant and equipment(a) $14,461 $15,921
(a) The decrease in total property, plant and equipment is primarily due to depreciation, disposals, impairments and the impact of foreign exchange, partially offset
by capital additions.
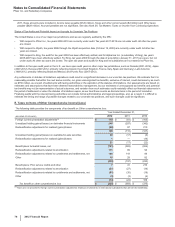
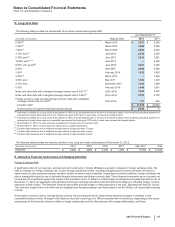
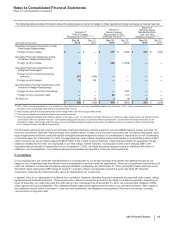
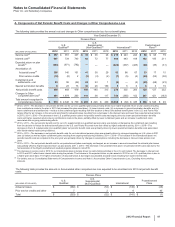
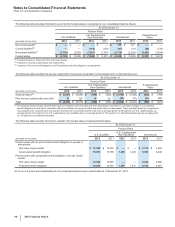
Note 10. Goodwill and Other Intangible Assets
A. Goodwill
The following table provides the components of and changes in the carrying amount of Goodwill:
(MILLIONS OF DOLLARS)
Primary
Care
Specialty
Care and
Oncology
Established
Products and
Emerging
Markets
Other
Operating
Segments(a) Total
Balance, January 1, 2011 $ 6,050 $16,659 $18,274 $2,449 $43,432
Additions(b) 129 300 321 55 805
Other(c) 50 138 151 (7) 332
Balance, December 31, 2011 6,229 17,097 18,746 2,497 44,569
Additions(d) ——91
514 605
Other(c) (77)(212)(234)21
(502)
Balance, December 31, 2012 $ 6,152 $16,885 $18,603 $3,032 $44,672
(a) Reflects amounts associated with Animal Health and Consumer Healthcare.
(b) Primarily reflects the acquisition of King (see Note 2A. Acquisitions, Divestitures, Collaborative Arrangements and Equity-Method Investments: Acquisitions).
(c) Primarily reflects the impact of foreign exchange.
(d) Related to our acquisitions of Ferrosan, Alacer and NextWave (see Note 2A. Acquisitions, Divestitures, Collaborative Arrangements and Equity-Method
Investments: Acquisitions).
As of December 31, 2012 and 2011, the gross goodwill balance was $45.2 billion and $45.1 billion, respectively. Accumulated goodwill
impairment losses, generated entirely by our Animal Health operating segment in fiscal 2002, were $536 million as of December 31, 2012 and
2011.