Pfizer 2012 Annual Report Download - page 58
Download and view the complete annual report
Please find page 58 of the 2012 Pfizer annual report below. You can navigate through the pages in the report by either clicking on the pages listed below, or by using the keyword search tool below to find specific information within the annual report.-
 1
1 -
2
-
3
-
4
-
5
-
6
-
7
-
8
-
9
-
10
-
11
-
12
-
13
-
14
-
15
-
16
-
17
-
18
-
19
-
20
-
21
-
22
-
23
-
24
-
25
-
26
-
27
-
28
-
29
-
30
-
31
-
32
-
33
-
34
-
35
-
36
-
37
-
38
-
39
-
40
-
41
-
42
-
43
-
44
-
45
-
46
-
47
-
 48
48 -
 49
49 -
 50
50 -
 51
51 -
 52
52 -
 53
53 -
 54
54 -
 55
55 -
 56
56 -
 57
57 -
 58
58 -
 59
59 -
 60
60 -
 61
61 -
 62
62 -
 63
63 -
 64
64 -
 65
65 -
 66
66 -
 67
67 -
 68
68 -
69
-
70
-
71
-
72
-
73
-
74
-
75
-
76
-
77
-
78
-
79
-
80
-
81
-
82
-
83
-
84
-
85
-
86
-
87
-
88
-
89
-
90
-
91
-
92
-
93
-
94
-
95
-
96
-
97
-
98
-
99
-
100
-
101
-
102
-
103
-
104
-
105
-
106
-
107
-
108
-
109
-
110
-
111
-
112
-
113
-
114
-
115
-
116
-
117
-
118
-
119
-
120
-
121
 |
 |

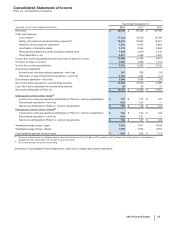
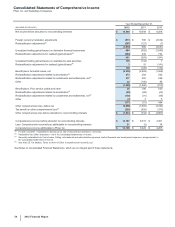
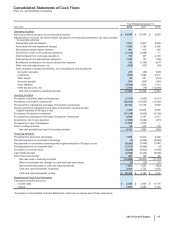
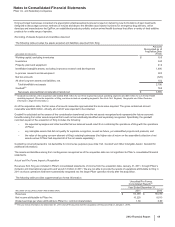
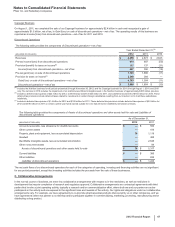
Consolidated Statements of Cash Flows
Pfizer Inc. and Subsidiary Companies
2012 Financial Report
57
Year Ended December 31,
(MILLIONS) 2012 2011 2010
Operating Activities
Net income before allocation to noncontrolling interests $14,598 $10,049 $8,288
Adjustments to reconcile net income before allocation to noncontrolling interests to net cash provided
by operating activities:
Depreciation and amortization 7,611 8,907 8,399
Asset write-offs and impairment charges 1,299 1,198 3,486
Share-based compensation expense 481 419 405
(Gain)/loss on sale of discontinued operations (7,123) (1,688)11
Deferred taxes from continuing operations 739 307 2,109
Deferred taxes from discontinued operations 1,459 147 (156)
Benefit plan contributions (in excess of)/less than expense 135 (1,769)(677)
Other non-cash adjustments, net (203)(172)(49)
Other changes in assets and liabilities, net of acquisitions and divestitures:
Accounts receivable 275 (66)(608)
Inventories (631)1,084 2,917
Other assets 83 701 (818)
Accounts payable 579 (367)(301)
Other liabilities (3,438) 1,508 1,114
Other tax accounts, net 1,190 (18) (12,666)
Net cash provided by operating activities 17,054 20,240 11,454
Investing Activities
Purchases of property, plant and equipment (1,327) (1,660)(1,513)
Purchases of short-term investments (24,018) (18,447) (11,082)
Proceeds from redemptions and sales of short-term investments 25,302 14,176 5,699
Net proceeds from redemptions and sales of short-term investments with
original maturities of 90 days or less 1,459 10,874 5,950
Purchases of long-term investments (11,145) (4,620)(4,128)
Proceeds from redemptions and sales of long-term investments 4,990 2,147 4,737
Acquisitions, net of cash acquired (1,050) (3,282)(273)
Proceeds from sale of businesses 11,850 2,376 —
Other investing activities 93 279 118
Net cash provided by/(used in) investing activities 6,154 1,843 (492)
Financing Activities
Proceeds from short-term borrowings 7,995 12,810 6,400
Principal payments on short-term borrowings (3) (3,826)(9,249)
Net payments on short-term borrowings with original maturities of 90 days or less (8,204) (7,540)(1,297)
Principal payments on long-term debt (1,513) (6,986)(6)
Purchases of common stock (8,228) (9,000)(1,000)
Cash dividends paid (6,534) (6,234)(6,088)
Other financing activities 488 169 66
Net cash used in financing activities (15,999) (20,607) (11,174)
Effect of exchange-rate changes on cash and cash equivalents (2) (29)(31)
Net increase/(decrease) in cash and cash equivalents 7,207 1,447 (243)
Cash and cash equivalents, beginning 3,182 1,735 1,978
Cash and cash equivalents, ending $10,389 $3,182 $1,735
Supplemental Cash Flow Information
Cash paid during the period for:
Income taxes $2,430 $2,938 $11,775
Interest 1,873 2,085 2,155
See Notes to Consolidated Financial Statements, which are an integral part of these statements.