Panera Bread 2007 Annual Report Download - page 96
Download and view the complete annual report
Please find page 96 of the 2007 Panera Bread annual report below. You can navigate through the pages in the report by either clicking on the pages listed below, or by using the keyword search tool below to find specific information within the annual report.-
 1
1 -
2
-
3
-
4
-
5
-
6
-
7
-
8
-
9
-
10
-
11
-
12
-
13
-
14
-
15
-
16
-
17
-
18
-
19
-
20
-
21
-
22
-
23
-
24
-
25
-
26
-
27
-
28
-
29
-
30
-
31
-
32
-
33
-
34
-
35
-
36
-
37
-
38
-
39
-
40
-
41
-
42
-
43
-
44
-
45
-
46
-
47
-
48
-
49
-
50
-
51
-
52
-
53
-
54
-
55
-
56
-
57
-
58
-
59
-
60
-
61
-
62
-
63
-
64
-
65
-
66
-
67
-
68
-
69
-
70
-
71
-
72
-
73
-
74
-
75
-
76
-
77
-
78
-
79
-
80
-
81
-
82
-
83
-
84
-
85
-
 86
86 -
 87
87 -
 88
88 -
 89
89 -
 90
90 -
 91
91 -
 92
92 -
 93
93 -
 94
94 -
 95
95 -
 96
96 -
 97
97 -
 98
98 -
 99
99 -
 100
100
 |
 |
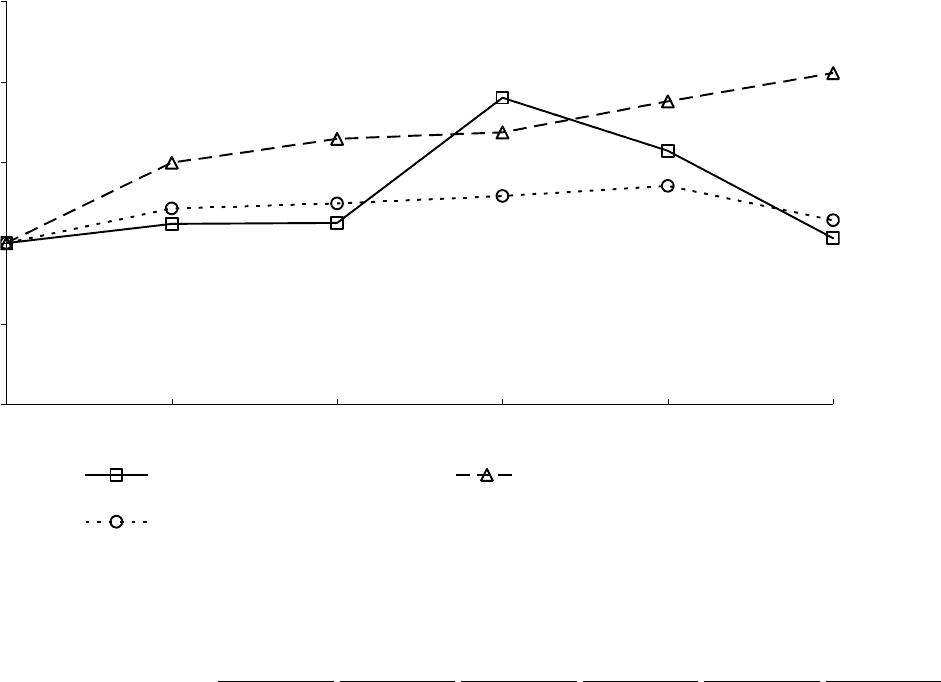
COMPARISON OF CUMULATIVE TOTAL RETURN
(Assumes $100 Investment on December 28, 2002)
The following graph and chart compares the cumulative annual stockholder return on our Class A Common Stock over the period
commencing December 28, 2002 and ending on December 25, 2007, to that of the total return for The NASDAQ Composite Index and
the Standard & Poor’s MidCap Restaurants Index, assuming an investment of $100 on December 28, 2002. In calculating total annual
stockholder return, reinvestment of dividends, if any, is assumed. The indices are included for comparative purposes only. They do
not necessarily reflect management’s opinion that such indices are an appropriate measure of the relative performance of our Class A
Common Stock and are not intended to forecast or be indicative of future performance of the Class A Common Stock. This graph is
not “soliciting material,” is not deemed filed with the Securities and Exchange Commission and is not to be incorporated by reference
in any of our filings under the Securities Act of 1933, as amended, or the Securities Exchange Act of 1934, as amended, whether made
before or after the date hereof and irrespective of any general incorporation language in any such filing. We obtained information
used on the graph from Research Data Group, Inc., a source we believe to be reliable, but we disclaim any responsibility for any errors
or omissions in such information.
COMPARISON OF 5 YEAR CUMULATIVE TOTAL RETURN*
Among Panera Bread Company, The NASDAQ Composite Index
and The S&P MidCap Restaurants Index
$0
$50
$100
$150
$200
$250
12/28/02 12/27/03 12/25/04 12/27/05 12/26/06 12/25/07
Panera Bread Company NASDAQ Composite
S&P MidCap Restaurants
* $100 invested on 12/28/02 in stock or 12/31/02 in index-including reinvestment of dividends.
Index calculated on month-end basis.
Base Period
December 28,
2002
December 27,
2003
December 25,
2004
December 27,
2005
December 26,
2006
December 25,
2007
Panera Bread Company........................ $100.00 $111.87 $112.52 $190.06 $157.09 $103.00
NASDAQ Composite Index................. $100.00 $149.75 $164.64 $168.60 $187.83 $205.22
S&P MidCap Restaurants Index .......... $100.00 $121.38 $124.55 $129.15 $135.39 $114.11
For the S&P MidCap Restaurants Index and the NASDAQ Composite Index, the total return to stockholders is based on the values
of such indices as of the last trading day of the relevant calendar year, which may be different from the end of our fiscal year.