Panera Bread 2007 Annual Report Download - page 42
Download and view the complete annual report
Please find page 42 of the 2007 Panera Bread annual report below. You can navigate through the pages in the report by either clicking on the pages listed below, or by using the keyword search tool below to find specific information within the annual report.-
 1
1 -
2
-
3
-
4
-
5
-
6
-
7
-
8
-
9
-
10
-
11
-
12
-
13
-
14
-
15
-
16
-
17
-
18
-
19
-
20
-
21
-
22
-
23
-
24
-
25
-
26
-
27
-
28
-
29
-
30
-
31
-
 32
32 -
 33
33 -
 34
34 -
 35
35 -
 36
36 -
 37
37 -
 38
38 -
 39
39 -
 40
40 -
 41
41 -
 42
42 -
 43
43 -
 44
44 -
 45
45 -
 46
46 -
 47
47 -
 48
48 -
 49
49 -
 50
50 -
 51
51 -
 52
52 -
53
-
54
-
55
-
56
-
57
-
58
-
59
-
60
-
61
-
62
-
63
-
64
-
65
-
66
-
67
-
68
-
69
-
70
-
71
-
72
-
73
-
74
-
75
-
76
-
77
-
78
-
79
-
80
-
81
-
82
-
83
-
84
-
85
-
86
-
87
-
88
-
89
-
90
-
91
-
92
-
93
-
94
-
95
-
96
-
97
-
98
-
99
-
100
 |
 |

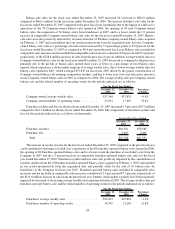
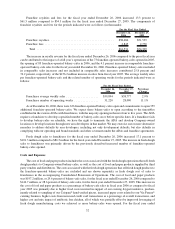
Franchise royalties and fees for the fiscal year ended December 26, 2006 increased 13.3 percent to
$61.5 million compared to $54.3 million for the fiscal year ended December 27, 2005. The components of
franchise royalties and fees for the periods indicated were as follows (in thousands):
December 26,
2006
December 27,
2005
For the Fical Year Ended
Franchise royalties ........................................ $58,686 $51,539
Franchise fees ........................................... 2,845 2,770
Total ................................................ $61,531 $54,309
The increase in royalty revenue for the fiscal year ended December 26, 2006 compared to the prior fiscal year
can be attributed to the impact of a full year’s operations of the 73 franchise-operated bakery-cafes opened in 2005,
the opening of 85 franchise-operated bakery-cafes in 2006, and the 4.1 percent increase in comparable franchise-
operated bakery-cafe sales for the fiscal year ended December 26, 2006. Franchise-operated bakery-cafes included
in comparable sales increases and not included in comparable sales increases contributed 25.8 percent and
74.2 percent, respectively, of the $156.2 million increase in sales from fiscal year 2005. The average weekly sales
per franchise-operated bakery-cafe and the related number of operating weeks for the periods indicated were as
follows:
December 26,
2006
December 27,
2005
Percentage
Change
For the Fiscal Year Ended
Franchisee average weekly sales .................... $39,894 $38,777 2.9%
Franchisee number of operating weeks ............... 31,220 28,090 11.1%
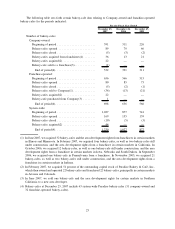
As of December 26, 2006, there were 636 franchise-operated bakery-cafes open and commitments to open 359
additional franchise-operated bakery-cafes. We expect these bakery-cafes to open according to the timetables
established in the various ADAs with franchisees, with the majority opening in the next four to five years. The ADA
requires a franchisee to develop a specified number of bakery-cafes on or before specific dates. If a franchisee fails
to develop bakery-cafes on schedule, we have the right to terminate the ADA and develop Company-owned
locations or develop locations through new area developers in that market. We may exercise one or more alternative
remedies to address defaults by area developers, including not only development defaults, but also defaults in
complying with our operating and brand standards and other covenants under the ADAs and franchise agreements.
Fresh dough sales to franchisees for the fiscal year ended December 26, 2006 increased 17.1 percent to
$101.3 million compared to $86.5 million for the fiscal year ended December 27, 2005. The increase in fresh dough
sales to franchisees was primarily driven by the previously described increased number of franchise-operated
bakery-cafes opened.
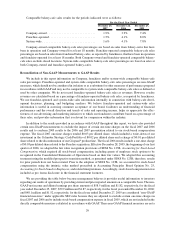
Costs and Expenses
The cost of food and paper products includes the costs associated with the fresh dough operations that sell fresh
dough products to Company-owned bakery-cafes, as well as the cost of food and paper products supplied by third
party vendors and distributors. The costs associated with the fresh dough operations that sell fresh dough products to
the franchise-operated bakery-cafes are excluded and are shown separately as fresh dough cost of sales to
franchisees in the accompanying Consolidated Statements of Operations. The cost of food and paper products
was $197.2 million, or 29.6 percent of bakery-cafe sales, for the fiscal year ended December 26, 2006 compared to
$142.7 million, or 28.6 percent of bakery-cafe sales, for the fiscal year ended December 27, 2005. This increase in
the cost of food and paper products as a percentage of bakery-cafe sales in fiscal year 2006 as compared to fiscal
year 2005 was primarily due to higher food costs incurred in support of our evening daypart initiative, predom-
inantly related to sampling of our Crispani»hand-crafted pizzas, increased paper costs related to our Via Panera»
catering business, higher costs from increased credit card transactions as a percentage of overall transactions, and
higher cost and mix impact of antibiotic free chicken, all of which was partially offset by improved leveraging of
fresh dough manufacturing costs we achieved as more bakery-cafes were opened. For the fiscal year ended
32