Panera Bread 2007 Annual Report Download - page 32
Download and view the complete annual report
Please find page 32 of the 2007 Panera Bread annual report below. You can navigate through the pages in the report by either clicking on the pages listed below, or by using the keyword search tool below to find specific information within the annual report.-
 1
1 -
2
-
3
-
4
-
5
-
6
-
7
-
8
-
9
-
10
-
11
-
12
-
13
-
14
-
15
-
16
-
17
-
18
-
19
-
20
-
21
-
 22
22 -
 23
23 -
 24
24 -
 25
25 -
 26
26 -
 27
27 -
 28
28 -
 29
29 -
 30
30 -
 31
31 -
 32
32 -
 33
33 -
 34
34 -
 35
35 -
 36
36 -
 37
37 -
 38
38 -
 39
39 -
 40
40 -
 41
41 -
 42
42 -
43
-
44
-
45
-
46
-
47
-
48
-
49
-
50
-
51
-
52
-
53
-
54
-
55
-
56
-
57
-
58
-
59
-
60
-
61
-
62
-
63
-
64
-
65
-
66
-
67
-
68
-
69
-
70
-
71
-
72
-
73
-
74
-
75
-
76
-
77
-
78
-
79
-
80
-
81
-
82
-
83
-
84
-
85
-
86
-
87
-
88
-
89
-
90
-
91
-
92
-
93
-
94
-
95
-
96
-
97
-
98
-
99
-
100
 |
 |

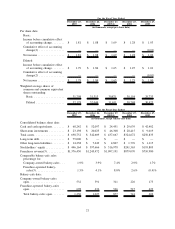
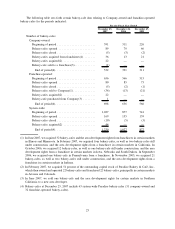
(1) In fiscal year 2005, we changed our fiscal week to end on Tuesday rather than Saturday. As a result, our 2005
fiscal year ended on December 27, 2005 instead of December 31, 2005 and, therefore, consisted of fifty-two and
a half weeks rather than the fifty-three week year that would have resulted without the calendar change. These
additional three days in fiscal 2005 did not have a material impact on our financial statements.
(2) Effective December 29, 2002, we adopted the provisions of Statement of Financial Accounting Standards
(SFAS) No. 143, Accounting for Asset Retirement Obligations. This Statement required us to record an estimate
for costs of retirement obligations that may be incurred at the end of lease terms of existing bakery-cafes or
other facilities. Upon adoption of SFAS No. 143, we recognized a one-time cumulative effect charge of
approximately $0.2 million (net of deferred tax benefit of approximately $0.1 million), or $0.01 per diluted
share.
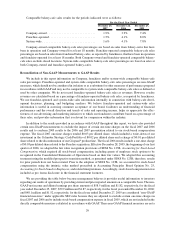
(3) Franchise-operated comparable bakery-cafe sales percentage is a non-GAAP measure, which should not be
considered in isolation or as a substitute for other measures of performance prepared in accordance with GAAP
and may not be comparable to franchise-operated comparable bakery-cafe sales as defined or used by other
companies. We do not record franchise-operated bakery-cafe sales as revenues. However, royalty revenues are
calculated based on a percentage of franchise-operated bakery-cafe sales. We use franchise-operated sales
information internally in connection with bakery-cafe development decisions, planning, and budgeting
analyses. We believe franchise-operated sales information is useful in assessing consumer acceptance of
the Company’s brand, facilitates an understanding of financial performance and the overall direction and trends
of sales and operating income, helps us appreciate the effectiveness of our advertising and marketing initiatives
to which our franchisees contribute based on a percentage of their sales, and provides information that is
relevant for comparison within the industry.
ITEM 7. MANAGEMENT’S DISCUSSION AND ANALYSIS OF FINANCIAL CONDITION AND
RESULTS OF OPERATIONS
General
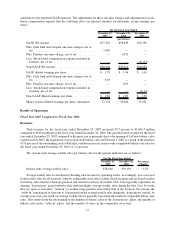
In fiscal year 2007, we earned $1.79 per diluted share with the following performance on key metrics: system-
wide comparable bakery-cafe sales growth of 1.6 percent (1.9 percent for Company-owned bakery-cafes and
1.5 percent for franchise-operated bakery-cafes); system-wide average weekly sales declined 1.2 percent to $38,668
($37,548 for Company-owned bakery-cafes and $39,433 for franchise-operated bakery-cafes); and 169 new
bakery-cafes opened system-wide, including 89 Company-owned bakery-cafes and 80 franchise-operated bak-
ery-cafes. Additionally, 36 bakery-cafes were acquired by the Company from franchisees, one bakery-cafe was sold
by the Company to a franchisee, and 10 bakery-cafes were closed system-wide, including five Company-owned
bakery-cafes and five franchise-operated bakery-cafes. Further, on February 1, 2007, we purchased 51 percent of
the outstanding stock of Paradise Bakery & Café, Inc., referred to as Paradise, then owner and operator of 22 bakery-
cafes and one commissary and franchisor of 22 bakery-cafes and one commissary. The fiscal 2007 results of $1.79
per diluted share also included charges totaling $0.03 per diluted share, which is comprised of a write-down of our
investment in the Columbia Strategic Cash Portfolio of $0.02 per diluted share and a charge of $0.01 per diluted
share related to the discontinuation of our Crispani»product line. See “Reconciliation of Non-GAAP Measure-
ments to GAAP Results” later in this section in this Form 10-K.
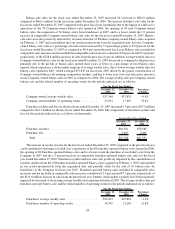
In fiscal year 2006, we earned $1.84 per diluted share with the following system-wide performance on key
metrics: comparable bakery-cafe sales growth of 4.1 percent (3.9 percent for Company-owned bakery-cafes and
4.1 percent for franchise-operated bakery-cafes); system-wide average weekly sales of $39,150 ($37,833 for
Company-owned bakery-cafes and $39,894 for franchise-operated bakery-cafes); and 155 new bakery-cafes
opened system-wide, including 70 Company-owned bakery-cafes and 85 franchise-operated bakery-cafes. The
fiscal 2006 results of $1.84 per diluted share also included a charge of $0.03 per diluted share related to the
acquisition of Paradise. See “Reconciliation of Non-GAAP Measurements to GAAP Results” later in this section in
this Form 10-K.
In fiscal year 2005, we earned $1.65 per diluted share with the following system-wide performance on key
metrics: comparable bakery-cafe sales growth of 7.8% (comparable bakery-cafe sales growth of 7.4% for
Company-owned bakery-cafes and 8.0% for franchise-operated bakery-cafes), system-wide average weekly sales
22