Panera Bread 2007 Annual Report Download - page 82
Download and view the complete annual report
Please find page 82 of the 2007 Panera Bread annual report below. You can navigate through the pages in the report by either clicking on the pages listed below, or by using the keyword search tool below to find specific information within the annual report.-
 1
1 -
2
-
3
-
4
-
5
-
6
-
7
-
8
-
9
-
10
-
11
-
12
-
13
-
14
-
15
-
16
-
17
-
18
-
19
-
20
-
21
-
22
-
23
-
24
-
25
-
26
-
27
-
28
-
29
-
30
-
31
-
32
-
33
-
34
-
35
-
36
-
37
-
38
-
39
-
40
-
41
-
42
-
43
-
44
-
45
-
46
-
47
-
48
-
49
-
50
-
51
-
52
-
53
-
54
-
55
-
56
-
57
-
58
-
59
-
60
-
61
-
62
-
63
-
64
-
65
-
66
-
67
-
68
-
69
-
70
-
71
-
 72
72 -
 73
73 -
 74
74 -
 75
75 -
 76
76 -
 77
77 -
 78
78 -
 79
79 -
 80
80 -
 81
81 -
 82
82 -
 83
83 -
 84
84 -
 85
85 -
 86
86 -
 87
87 -
 88
88 -
 89
89 -
 90
90 -
 91
91 -
 92
92 -
93
-
94
-
95
-
96
-
97
-
98
-
99
-
100
 |
 |

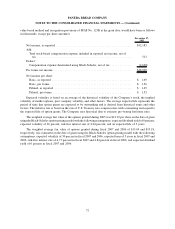
value based method and recognition provisions of SFAS No. 123R at the grant date, would have been as follows
(in thousands, except per share amounts):
December 27,
2005
Net income, as reported ............................................... $52,183
Add:
Total stock-based compensation expense included in reported net income, net of
tax ........................................................... 513
Deduct:
Compensation expense determined using Black-Scholes, net of tax .............. (4,628)
Pro forma net income ................................................. $48,068
Net income per share:
Basic, as reported .................................................. $ 1.69
Basic, pro forma ................................................... $ 1.56
Diluted, as reported ................................................. $ 1.65
Diluted, pro forma ................................................. $ 1.52
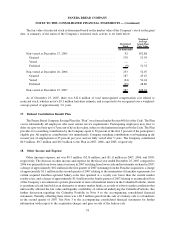
Expected volatility is based on an average of the historical volatility of the Company’s stock, the implied
volatility of market options, peer company volatility, and other factors. The average expected life represents the
period of time that option grants are expected to be outstanding and is derived from historical terms and other
factors. The risk-free rate is based on the rate of U.S. Treasury zero-coupon issues with a remaining term equal to
the expected life of option grants. The Company uses historical data to estimate pre-vesting forfeiture rates.
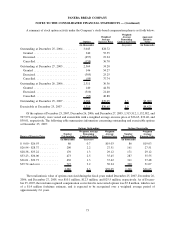
The weighted average fair value of the options granted during 2005 was $21.19 per share on the date of grant
using the Black-Scholes option-pricing model with the following assumptions: expected dividend yield of 0 percent,
expected volatility of 36 percent, risk-free interest rate of 4.04 percent, and an expected life of 5 years.
The weighted average fair value of options granted during fiscal 2007 and 2006 of $15.69 and $19.18,
respectively, was estimated on the date of grant using the Black-Scholes option-pricing model with the following
assumptions: expected volatility of 30 percent in fiscal 2007 and 2006, expected term of 5 years in fiscal 2007 and
2006, risk-free interest rate of 4.73 percent in fiscal 2007 and 4.84 percent in fiscal 2006, and expected dividend
yield of 0 percent in fiscal 2007 and 2006.
72
PANERA BREAD COMPANY
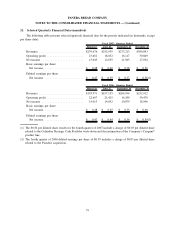
NOTES TO THE CONSOLIDATED FINANCIAL STATEMENTS — (Continued)