Panera Bread 2007 Annual Report Download - page 31
Download and view the complete annual report
Please find page 31 of the 2007 Panera Bread annual report below. You can navigate through the pages in the report by either clicking on the pages listed below, or by using the keyword search tool below to find specific information within the annual report.-
 1
1 -
2
-
3
-
4
-
5
-
6
-
7
-
8
-
9
-
10
-
11
-
12
-
13
-
14
-
15
-
16
-
17
-
18
-
19
-
20
-
 21
21 -
 22
22 -
 23
23 -
 24
24 -
 25
25 -
 26
26 -
 27
27 -
 28
28 -
 29
29 -
 30
30 -
 31
31 -
 32
32 -
 33
33 -
 34
34 -
 35
35 -
 36
36 -
 37
37 -
 38
38 -
 39
39 -
 40
40 -
 41
41 -
42
-
43
-
44
-
45
-
46
-
47
-
48
-
49
-
50
-
51
-
52
-
53
-
54
-
55
-
56
-
57
-
58
-
59
-
60
-
61
-
62
-
63
-
64
-
65
-
66
-
67
-
68
-
69
-
70
-
71
-
72
-
73
-
74
-
75
-
76
-
77
-
78
-
79
-
80
-
81
-
82
-
83
-
84
-
85
-
86
-
87
-
88
-
89
-
90
-
91
-
92
-
93
-
94
-
95
-
96
-
97
-
98
-
99
-
100
 |
 |

December 25,
2007
December 26,
2006
December 27,
2005(1)
December 25,
2004
December 27,
2003
For the Fiscal Year Ended
(in thousands, except per share data)
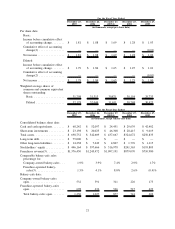
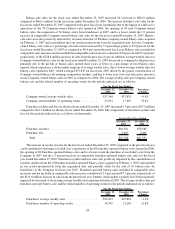
Per share data:
Basic:
Income before cumulative effect
of accounting change ........ $ 1.81 $ 1.88 $ 1.69 $ 1.28 $ 1.03
Cumulative effect of accounting
change(2) ................ — — — — (0.01)
Net income ................. $ 1.81 $ 1.88 $ 1.69 $ 1.28 $ 1.02
Diluted:
Income before cumulative effect
of accounting change ........ $ 1.79 $ 1.84 $ 1.65 $ 1.25 $ 1.01
Cumulative effect of accounting
change(2) ................ — — — — (0.01)
Net income ................. $ 1.79 $ 1.84 $ 1.65 $ 1.25 $ 1.00
Weighted average shares of
common and common equivalent
shares outstanding:
Basic ................... 31,708 31,313 30,871 30,154 29,733
Diluted .................. 32,178 32,044 31,651 30,768 30,423
December 25,
2007
December 26,
2006
December 27,
2005(1)
December 25,
2004
December 27,
2003
For the Fiscal Year Ended
(in thousands, except bakery-cafe data)
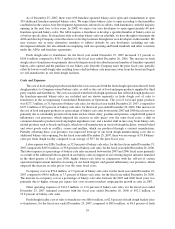
Consolidated balance sheet data:
Cash and cash equivalents ........ $ 68,242 $ 52,097 $ 24,451 $ 29,639 $ 42,402
Short-term investments .......... $ 23,198 $ 20,025 $ 46,308 $ 28,415 $ 9,019
Total assets................... $ 698,752 $ 542,609 $ 437,667 $324,672 $256,835
Long-term debt................ $ 75,000 $ — $ — $ — $ —
Other long-term liabilities ........ $ 14,238 $ 7,649 $ 4,867 $ 1,776 $ 1,115
Stockholders’ equity ............ $ 446,164 $ 397,666 $ 316,978 $241,363 $193,805
Franchisee revenue(3) ........... $1,376,430 $1,245,472 $1,097,191 $879,070 $710,980
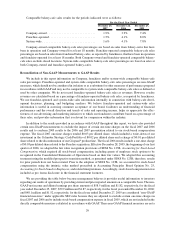
Comparable bakery-cafe sales
percentage for:
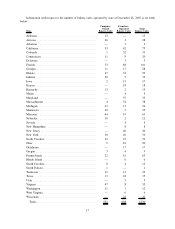
Company-owned bakery-cafes . . . 1.9% 3.9% 7.4% 2.9% 1.7%
Franchise-operated bakery-
cafes(3) .................. 1.5% 4.1% 8.0% 2.6% (0.4)%
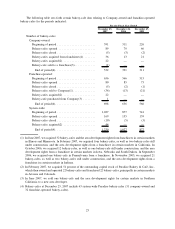
Bakery-cafe data:
Company-owned bakery-cafes
open ...................... 532 391 311 226 173
Franchise-operated bakery-cafes
open ...................... 698 636 566 515 429
Total bakery-cafes open........ 1,230 1,027 877 741 602
21