Panera Bread 2007 Annual Report Download - page 39
Download and view the complete annual report
Please find page 39 of the 2007 Panera Bread annual report below. You can navigate through the pages in the report by either clicking on the pages listed below, or by using the keyword search tool below to find specific information within the annual report.-
 1
1 -
2
-
3
-
4
-
5
-
6
-
7
-
8
-
9
-
10
-
11
-
12
-
13
-
14
-
15
-
16
-
17
-
18
-
19
-
20
-
21
-
22
-
23
-
24
-
25
-
26
-
27
-
28
-
 29
29 -
 30
30 -
 31
31 -
 32
32 -
 33
33 -
 34
34 -
 35
35 -
 36
36 -
 37
37 -
 38
38 -
 39
39 -
 40
40 -
 41
41 -
 42
42 -
 43
43 -
 44
44 -
 45
45 -
 46
46 -
 47
47 -
 48
48 -
 49
49 -
50
-
51
-
52
-
53
-
54
-
55
-
56
-
57
-
58
-
59
-
60
-
61
-
62
-
63
-
64
-
65
-
66
-
67
-
68
-
69
-
70
-
71
-
72
-
73
-
74
-
75
-
76
-
77
-
78
-
79
-
80
-
81
-
82
-
83
-
84
-
85
-
86
-
87
-
88
-
89
-
90
-
91
-
92
-
93
-
94
-
95
-
96
-
97
-
98
-
99
-
100
 |
 |
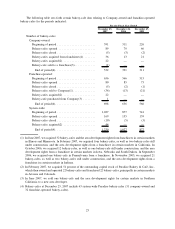
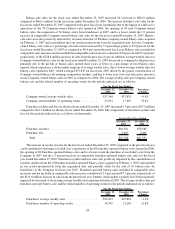
As of December 25, 2007, there were 698 franchise-operated bakery-cafes open and commitments to open
303 additional franchise-operated bakery-cafes. We expect these bakery-cafes to open according to the timetables
established in the various Area Development Agreements, referred to as ADAs, with franchisees, with the majority
opening in the next four to five years. In 2008, we expect our area developers to open approximately 60 new
franchise-operated bakery-cafes. The ADA requires a franchisee to develop a specified number of bakery-cafes on
or before specific dates. If a franchisee fails to develop bakery-cafes on schedule, we have the right to terminate the
ADA and develop Company-owned locations or develop locations through new area developers in that market. We
may exercise one or more alternative remedies to address defaults by area developers, including not only
development defaults, but also defaults in complying with our operating and brand standards and other covenants
under the ADAs and franchise agreements.
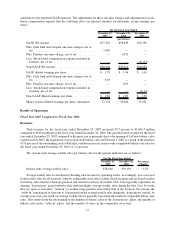
Fresh dough sales to franchisees for the fiscal year ended December 25, 2007 increased 3.3 percent to
$104.6 million compared to $101.3 million for the fiscal year ended December 26, 2006. The increase in fresh
dough sales to franchisees was primarily driven by the previously described increased number of franchise-operated
bakery-cafes opened and the purchase of one bakery-cafe from the Company since the prior fiscal year, partially
offset by lower overall dough sales resulting from a shift in bakery-cafe menu mix away from the bread and bagels
we self-manufacture in our fresh dough facilities.
Costs and Expenses
The cost of food and paper products includes the costs associated with the fresh dough operations that sell fresh
dough products to Company-owned bakery-cafes, as well as the cost of food and paper products supplied by third
party vendors and distributors. The costs associated with the fresh dough operations that sell fresh dough products to
the franchise-operated bakery-cafes are excluded and are shown separately as fresh dough cost of sales to
franchisees in the accompanying Consolidated Statements of Operations. The cost of food and paper products
was $277.7 million, or 31.0 percent of bakery-cafe sales, for the fiscal year ended December 25, 2007, compared to
$197.2 million or 29.6 percent of bakery-cafe sales, for the fiscal year ended December 26, 2006. This increase in
the cost of food and paper products as a percentage of bakery-cafe sales between the 2007 and 2006 fiscal years was
primarily due to commodity pressures from items such as wheat, dairy, gasoline and proteins, coupled with general
inflationary cost pressures, which outpaced the increase in sales prices over the same fiscal years; a shift in
consumer demand to products involving higher ingredient costs; and a modest shift in mix away from bakery-cafe
related products such as breads and bagels, which we self-manufacture in our fresh dough facilities, towards baked
and sweet goods such as soufflés, scones and muffins, which are produced through a contract manufacturer.
Partially offsetting these cost pressures was improved leverage of our fresh dough manufacturing costs due to
additional bakery-cafes opening. For the fiscal year ended December 25, 2007, there was an average of 55.8 bakery-
cafes per fresh dough facility compared to an average of 50.7 for the prior fiscal year.
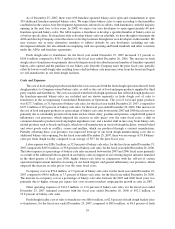
Labor expense was $286.2 million, or 32.0 percent of bakery-cafe sales, for the fiscal year ended December 25,
2007 compared to $205.0 million, or 30.8 percent of bakery-cafe sales, for the fiscal year ended December 26, 2006.
The labor expense as a percentage of bakery-cafe sales increased between the 2007 and 2006 fiscal years primarily
as a result of the additional labor required in our bakery-cafes in support of our evening daypart initiative launched
in the third quarter of fiscal year 2006, higher bakery-cafe labor in conjunction with the roll-out of certain
operational improvement initiatives focusing on our lunch daypart, and general inflationary cost pressures, which
outpaced the increase in sales prices over the same fiscal years.
Occupancy cost was $70.4 million, or 7.9 percent of bakery-cafe sales, for the fiscal year ended December 25,
2007 compared to $48.6 million, or 7.3 percent of bakery-cafe sales, for the fiscal year ended December 26, 2006.
The increase in occupancy cost as a percentage of bakery-cafe sales between the 2007 and 2006 fiscal years was
primarily due to higher average per square foot costs in newer markets outpacing the growth in sales in 2007.
Other operating expenses of $121.3 million, or 13.6 percent of bakery-cafe sales, for the fiscal year ended
December 25, 2007 remained consistent with the fiscal year ended December 26, 2006 of $92.2 million, or
13.8 percent of bakery-cafe sales.
Fresh dough facility cost of sales to franchisees was $86.6 million, or 82.8 percent of fresh dough facility sales
to franchisees, for the fiscal year ended December 25, 2007, compared to $85.6 million, or 84.5 percent of fresh
29