Panera Bread 2007 Annual Report Download - page 33
Download and view the complete annual report
Please find page 33 of the 2007 Panera Bread annual report below. You can navigate through the pages in the report by either clicking on the pages listed below, or by using the keyword search tool below to find specific information within the annual report.-
 1
1 -
2
-
3
-
4
-
5
-
6
-
7
-
8
-
9
-
10
-
11
-
12
-
13
-
14
-
15
-
16
-
17
-
18
-
19
-
20
-
21
-
22
-
 23
23 -
 24
24 -
 25
25 -
 26
26 -
 27
27 -
 28
28 -
 29
29 -
 30
30 -
 31
31 -
 32
32 -
 33
33 -
 34
34 -
 35
35 -
 36
36 -
 37
37 -
 38
38 -
 39
39 -
 40
40 -
 41
41 -
 42
42 -
 43
43 -
44
-
45
-
46
-
47
-
48
-
49
-
50
-
51
-
52
-
53
-
54
-
55
-
56
-
57
-
58
-
59
-
60
-
61
-
62
-
63
-
64
-
65
-
66
-
67
-
68
-
69
-
70
-
71
-
72
-
73
-
74
-
75
-
76
-
77
-
78
-
79
-
80
-
81
-
82
-
83
-
84
-
85
-
86
-
87
-
88
-
89
-
90
-
91
-
92
-
93
-
94
-
95
-
96
-
97
-
98
-
99
-
100
 |
 |
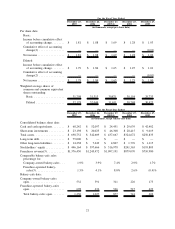
of $38,318 ($37,348 for Company-owned bakery-cafes and $38,777 for franchise-operated bakery-cafes), and 139
new bakery-cafes opened system-wide, including 66 Company-owned bakery-cafes and 73 franchise-operated
bakery-cafes. The fiscal 2005 results of $1.65 per diluted share do not include stock-based compensation expense of
$0.13 per diluted share because SFAS No. 123R, Accounting for Stock-based Compensation, did not require the
expensing of stock options in fiscal 2005. See “Reconciliation of Non-GAAP Measurements to GAAP Results”
later in this section in this Form 10-K.
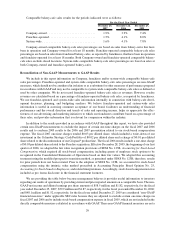
We include in this report information on Company, franchisee and/or system-wide comparable bakery-cafe
sales percentages. Franchise-operated and system-wide comparable bakery-cafe sales percentages are non-GAAP
measures, which should not be considered in isolation or as a substitute for other measures of performance prepared
in accordance with Generally Accepted Accounting Principles, or GAAP, and may not be comparable to system-
wide comparable bakery-cafe sales as defined or used by other companies. We do not record franchise-operated
bakery-cafe sales as revenues. However, royalty revenues are calculated based on a percentage of franchise-
operated bakery-cafe sales, as reported by franchisees. We use franchise-operated and system-wide sales infor-
mation internally in connection with store development decisions, planning, and budgeting analyses. We believe
franchise-operated and system-wide sales information is useful in assessing consumer acceptance of our brand,
facilitates an understanding of financial performance and the overall direction and trends of sales and operating
income, helps us appreciate the effectiveness of our advertising and marketing initiatives to which our franchisees
contribute based on a percentage of their sales, and provides information that is relevant for comparison within the
industry.
Our revenues are derived from Company-owned bakery-cafe sales, fresh dough sales to franchisees, and
franchise royalties and fees. Fresh dough sales to franchisees are primarily the sales of dough products and sales of
tuna and cream cheese to certain of our franchisees. Franchise royalties and fees include royalty income and
franchise fees. The cost of food and paper products, labor, occupancy, and other operating expenses relate primarily
to Company-owned bakery-cafe sales. The cost of fresh dough sales relates primarily to the sale of fresh dough
products and tuna and cream cheese to franchisees. General and administrative, depreciation and amortization, and
pre-opening expenses relate to all areas of revenue generation.
In fiscal 2006, we adopted a new quarterly fiscal calendar whereby each of our quarters include 13 weeks
(4 week, 5 week, and 4 week period progressions in each quarter), rather than our prior quarterly fiscal calendar
which had 16 weeks in the first quarter and 12 weeks in the second, third, and fourth quarters (4 week period
progressions in each quarter).
In fiscal year 2005, we changed our fiscal week to end on Tuesday rather than Saturday, with our fiscal year
ending on the last Tuesday in December. This change allowed us to better serve customers by shifting the weekly
closing activities to a less busy day of the week. As a result, our 2005 fiscal year ended on December 27, 2005
instead of December 31, 2005 and, therefore, consisted of fifty-two and a half weeks rather than the fifty-three week
year that would have resulted without the calendar change. These additional three days in fiscal year 2005 did not
have a material impact on our financial statements. As a result of this calendar change, the next fifty-three week
fiscal year will occur in fiscal year 2008.
23