Panera Bread 2007 Annual Report Download - page 41
Download and view the complete annual report
Please find page 41 of the 2007 Panera Bread annual report below. You can navigate through the pages in the report by either clicking on the pages listed below, or by using the keyword search tool below to find specific information within the annual report.-
 1
1 -
2
-
3
-
4
-
5
-
6
-
7
-
8
-
9
-
10
-
11
-
12
-
13
-
14
-
15
-
16
-
17
-
18
-
19
-
20
-
21
-
22
-
23
-
24
-
25
-
26
-
27
-
28
-
29
-
30
-
 31
31 -
 32
32 -
 33
33 -
 34
34 -
 35
35 -
 36
36 -
 37
37 -
 38
38 -
 39
39 -
 40
40 -
 41
41 -
 42
42 -
 43
43 -
 44
44 -
 45
45 -
 46
46 -
 47
47 -
 48
48 -
 49
49 -
 50
50 -
 51
51 -
52
-
53
-
54
-
55
-
56
-
57
-
58
-
59
-
60
-
61
-
62
-
63
-
64
-
65
-
66
-
67
-
68
-
69
-
70
-
71
-
72
-
73
-
74
-
75
-
76
-
77
-
78
-
79
-
80
-
81
-
82
-
83
-
84
-
85
-
86
-
87
-
88
-
89
-
90
-
91
-
92
-
93
-
94
-
95
-
96
-
97
-
98
-
99
-
100
 |
 |

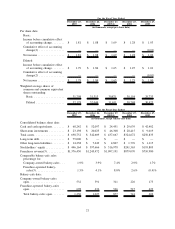
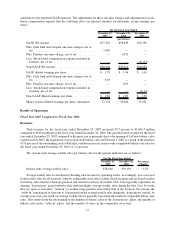
Fiscal Year 2006 Compared to Fiscal Year 2005
Revenues
Total revenues for the fiscal year ended December 26, 2006 increased 29.5 percent to $829.0 million compared
to $640.3 million for the fiscal year ended December 27, 2005. The growth in total revenue for the fiscal year ended
December 26, 2006 compared to the prior fiscal year was primarily due to the opening of 155 new bakery-cafes
system-wide in 2006 and the increases in system-wide comparable bakery-cafe sale for the fiscal year ended
December 26, 2006 of 4.1 percent.
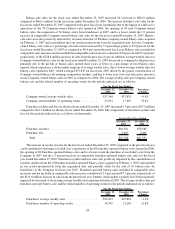
The system-wide average weekly sales per bakery-cafe for the periods indicated were as follows:
December 26,
2006
December 27,
2005
Percentage
Change
For the Fiscal Year Ended
System-wide average weekly sales................... $39,150 $38,318 2.2%
Average weekly sales is calculated by dividing total net sales by operating weeks. Accordingly, year-over-year
results reflect sales for all locations, whereas comparable store sales exclude closed locations and are based on sales
for bakery-cafes that have been in operation and owned for at least 18 months. New stores typically experience an
opening “honeymoon” period whereby they generate higher average weekly sales during the first 12 to 16 weeks
they are open as customers “settle-in” to normal usage patterns from initial trial of the location. On average, the
“settle-in” experienced is 5 percent to 10 percent from the average weekly sales during the “honeymoon” period. As
a result, year-over-year results of average weekly sales is generally lower than the results in comparable bakery-cafe
sales. This results from the relationship of the number of bakery-cafes in the “honeymoon” phase, the number of
bakery-cafes in the “settle-in” phase, and the number of stores in the comparable store base.
As described above, we had an additional three days in the first quarter of 2006 as compared to the first quarter
of 2005 as a result of changing our fiscal week in 2005 to end on Tuesday rather than Saturday. Average weekly sales
and comparable bakery-cafe sales exclude these three additional days in the first quarter of 2005 for comparative
purposes.
Bakery-cafe sales for the fiscal year ended December 26, 2006 increased 33.4 percent to $666.1 million
compared to $499.4 million for the fiscal year ended December 27, 2005. Company-owned bakery-cafe sales as a
percentage of total revenue increased by 2.4 percentage points for the fiscal year ended December 26, 2006
compared to the fiscal year ended December 27, 2005, primarily as a result of the increase in the number of
Company-owned bakery-cafe openings. The increase in bakery-cafe sales was primarily due to the impact of a full
year’s operations of the 66 Company-owned bakery-cafes opened in 2005, the opening of 70 Company-owned
bakery-cafes in 2006, and the 3.9 percent increase in comparable bakery-cafe sales for the fiscal year ended
December 26, 2006. Bakery-cafes included in comparable sales increases and not included in comparable sales
increases contributed 10.1 percent and 89.9 percent, respectively, of the $166.7 million increase in sales from 2005.
In addition, average weekly sales for Company-owned bakery-cafes for the fiscal year ended December 26, 2006
increased as compared to the same period in 2005 primarily as a result of initiatives to increase our evening daypart
transactions in 2006 as compared to 2005 and as a result of greater year-over-year sales price increases in 2006 as
compared to 2005. The average weekly sales per Company-owned bakery-cafe and the related number of operating
weeks for the periods indicated were as follows:
December 26,
2006
December 27,
2005
Percentage
Change
For the Fiscal Year Ended
Company-owned average weekly sales ................ $37,833 $37,348 1.3%
Company-owned number of operating weeks ........... 17,607 13,280 32.6%
31