Panera Bread 2007 Annual Report Download - page 36
Download and view the complete annual report
Please find page 36 of the 2007 Panera Bread annual report below. You can navigate through the pages in the report by either clicking on the pages listed below, or by using the keyword search tool below to find specific information within the annual report.-
 1
1 -
2
-
3
-
4
-
5
-
6
-
7
-
8
-
9
-
10
-
11
-
12
-
13
-
14
-
15
-
16
-
17
-
18
-
19
-
20
-
21
-
22
-
23
-
24
-
25
-
 26
26 -
 27
27 -
 28
28 -
 29
29 -
 30
30 -
 31
31 -
 32
32 -
 33
33 -
 34
34 -
 35
35 -
 36
36 -
 37
37 -
 38
38 -
 39
39 -
 40
40 -
 41
41 -
 42
42 -
 43
43 -
 44
44 -
 45
45 -
 46
46 -
47
-
48
-
49
-
50
-
51
-
52
-
53
-
54
-
55
-
56
-
57
-
58
-
59
-
60
-
61
-
62
-
63
-
64
-
65
-
66
-
67
-
68
-
69
-
70
-
71
-
72
-
73
-
74
-
75
-
76
-
77
-
78
-
79
-
80
-
81
-
82
-
83
-
84
-
85
-
86
-
87
-
88
-
89
-
90
-
91
-
92
-
93
-
94
-
95
-
96
-
97
-
98
-
99
-
100
 |
 |

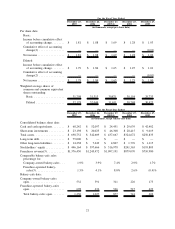
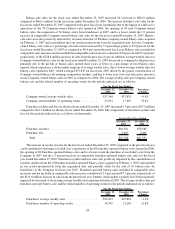
Comparable bakery-cafe sales results for the periods indicated were as follows:
December 25,
2007
December 26,
2006
December 27,
2005
For the Fiscal Year Ended
Company-owned .............................. 1.9% 3.9% 7.4%
Franchise-operated............................. 1.5% 4.1% 8.0%
System-wide ................................. 1.6% 4.1% 7.8%
Company-owned comparable bakery-cafe sales percentages are based on sales from bakery-cafes that have
been in operation and Company-owned for at least 18 months. Franchise-operated comparable bakery-cafe sales
percentages are based on sales from franchised bakery-cafes, as reported by franchisees, that have been in operation
and franchise-operated for at least 18 months. Both Company-owned and franchise-operated comparable bakery-
cafe sales exclude closed locations. System-wide comparable bakery-cafe sales percentages are based on sales at
both Company-owned and franchise-operated bakery-cafes.
Reconciliation of Non-GAAP Measurements to GAAP Results
We include in this report information on Company, franchisee and/or system-wide comparable bakery-cafe
sales percentages. Franchise-operated and system-wide comparable bakery-cafe sales percentages are non-GAAP
measures, which should not be considered in isolation or as a substitute for other measures of performance prepared
in accordance with GAAP and may not be comparable to system-wide comparable bakery-cafe sales as defined or
used by other companies. We do not record franchise-operated bakery-cafe sales as revenues. However, royalty
revenues are calculated based on a percentage of franchise-operated bakery-cafe sales, as reported by franchisees.
We use franchise-operated and system-wide sales information internally in connection with bakery-cafe devel-
opment decisions, planning, and budgeting analyses. We believe franchise-operated and system-wide sales
information is useful in assessing consumer acceptance of our brand, facilitates an understanding of financial
performance and the overall direction and trends of sales and operating income, helps us appreciate the effec-
tiveness of our advertising and marketing initiatives to which our franchisees contribute based on a percentage of
their sales, and provides information that is relevant for comparison within the industry.
In addition to the results provided in accordance with GAAP throughout this report, we have also provided
certain non-GAAP measurements to exclude the impact of certain one-time charges on the fiscal 2007 and 2006
results and to conform 2005 results to the 2006 and 2007 presentation related to our stock-based compensation
expense. The fiscal 2007 one-time charges totaled $0.03 per diluted share, which included a write-down of our
investment in the Columbia Strategic Cash Portfolio of $0.02 per diluted share and a charge of $0.01 per diluted
share related to the discontinuation of our Crispani»product line. The fiscal 2006 results include a one-time charge
of $0.03 per diluted share related to the Paradise acquisition. Effective December 28, 2005, the beginning of our first
quarter of 2006, we adopted the fair value recognition provisions of SFAS No. 123R, Accounting for Stock-based
Compensation, which required all stock-based compensation, including grants of employee stock options to be
recognized in the Consolidated Statements of Operations based on their fair values. We adopted this accounting
treatment using the modified prospective transition method, as permitted under SFAS No. 123R; therefore, results
for prior periods have not been restated. Prior to the adoption of SFAS No. 123R, we accounted for stock-based
compensation using the intrinsic value method prescribed in Accounting Principles Board Opinion No. 25,
Accounting for Stock Issued to Employees, and related interpretations. Accordingly, stock-based compensation was
included as pro forma disclosure in the financial statement footnotes.
We are providing the table below because management believes it provides useful information to investors
regarding our results of operations by providing current and prior reported amounts on a comparable basis. The non-
GAAP net income and diluted earnings per share amounts of $58.5 million and $1.82, respectively, for the fiscal
year ended December 25, 2007; $59.9 million and $1.87, respectively, for the fiscal year ended December 26, 2006;
and $48.1 million and $1.52, respectively, for the fiscal year ended December 27, 2005 are considered “non-GAAP
financial measures” under applicable SEC rules because they are adjusted to exclude certain one-time charges in
fiscal 2007 and 2006 and to include stock-based compensation expense in fiscal 2005, which are not included in the
directly comparable measures calculated in accordance with GAAP. These non-GAAP financial measures are not a
26