Panera Bread 2007 Annual Report Download - page 26
Download and view the complete annual report
Please find page 26 of the 2007 Panera Bread annual report below. You can navigate through the pages in the report by either clicking on the pages listed below, or by using the keyword search tool below to find specific information within the annual report.-
 1
1 -
2
-
3
-
4
-
5
-
6
-
7
-
8
-
9
-
10
-
11
-
12
-
13
-
14
-
15
-
 16
16 -
 17
17 -
 18
18 -
 19
19 -
 20
20 -
 21
21 -
 22
22 -
 23
23 -
 24
24 -
 25
25 -
 26
26 -
 27
27 -
 28
28 -
 29
29 -
 30
30 -
 31
31 -
 32
32 -
 33
33 -
 34
34 -
 35
35 -
 36
36 -
37
-
38
-
39
-
40
-
41
-
42
-
43
-
44
-
45
-
46
-
47
-
48
-
49
-
50
-
51
-
52
-
53
-
54
-
55
-
56
-
57
-
58
-
59
-
60
-
61
-
62
-
63
-
64
-
65
-
66
-
67
-
68
-
69
-
70
-
71
-
72
-
73
-
74
-
75
-
76
-
77
-
78
-
79
-
80
-
81
-
82
-
83
-
84
-
85
-
86
-
87
-
88
-
89
-
90
-
91
-
92
-
93
-
94
-
95
-
96
-
97
-
98
-
99
-
100
 |
 |

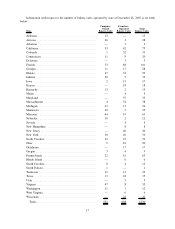
Information with respect to our Company-owned leased fresh dough facilities as of December 25, 2007 is set
forth below:
Facility Square Footage
Atlanta, GA ....................................................... 18,000
Beltsville, MD ..................................................... 22,300
Chicago, IL ....................................................... 30,900
Cincinnati, OH ..................................................... 22,300
Dallas, TX ........................................................ 12,900
Denver,CO ....................................................... 10,000
Detroit, MI........................................................ 19,600
Fairfield, NJ ....................................................... 50,900
Franklin, MA(1) .................................................... 40,300
Greensboro, NC .................................................... 19,200
Kansas City, KS .................................................... 20,100
Minneapolis, MN ................................................... 11,100
Miramar, FL ...................................................... 15,100
Ontario, CA ....................................................... 13,900
Orlando, FL ....................................................... 16,500
Phoenix, AZ....................................................... 7,000
Seattle, WA ....................................................... 16,600
St. Louis, MO ..................................................... 30,000
Stockton, CA ...................................................... 14,300
Warren, OH ....................................................... 16,300
(1) Total square footage includes approximately 20,000 square feet utilized in tuna and cream cheese production.
16