Panera Bread 2007 Annual Report Download - page 37
Download and view the complete annual report
Please find page 37 of the 2007 Panera Bread annual report below. You can navigate through the pages in the report by either clicking on the pages listed below, or by using the keyword search tool below to find specific information within the annual report.-
 1
1 -
2
-
3
-
4
-
5
-
6
-
7
-
8
-
9
-
10
-
11
-
12
-
13
-
14
-
15
-
16
-
17
-
18
-
19
-
20
-
21
-
22
-
23
-
24
-
25
-
26
-
 27
27 -
 28
28 -
 29
29 -
 30
30 -
 31
31 -
 32
32 -
 33
33 -
 34
34 -
 35
35 -
 36
36 -
 37
37 -
 38
38 -
 39
39 -
 40
40 -
 41
41 -
 42
42 -
 43
43 -
 44
44 -
 45
45 -
 46
46 -
 47
47 -
48
-
49
-
50
-
51
-
52
-
53
-
54
-
55
-
56
-
57
-
58
-
59
-
60
-
61
-
62
-
63
-
64
-
65
-
66
-
67
-
68
-
69
-
70
-
71
-
72
-
73
-
74
-
75
-
76
-
77
-
78
-
79
-
80
-
81
-
82
-
83
-
84
-
85
-
86
-
87
-
88
-
89
-
90
-
91
-
92
-
93
-
94
-
95
-
96
-
97
-
98
-
99
-
100
 |
 |

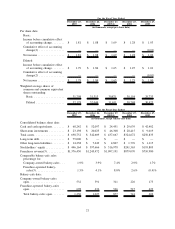
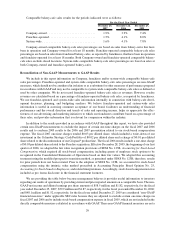
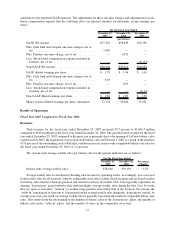
substitute for the reported GAAP measures. The adjustments for these one-time charges and adjustment for stock-
based compensation expense had the following effect on reported amounts (in thousands, except earnings per
share):
December 25,
2007
December 26,
2006
December 27,
2005
For the Fiscal Year Ended
(pro-forma)
GAAP Net income ............................ $57,456 $58,849 $52,183
Plus: Cash fund and Crispani one-time charges, net of
tax ...................................... 1,090 — —
Plus: Paradise one-time charge, net of tax ........... — 1,072 —
Less: Stock-based compensation expense included in
footnote, net of tax .......................... — — (4,115)
Non-GAAP Net income ......................... $58,546 $59,921 $48,068
GAAP diluted earnings per share .................. $ 1.79 $ 1.84 $ 1.65
Plus: Cash fund and Crispani one-time charges, net of
tax ...................................... 0.03 — —
Plus: Paradise one-time charge, net of tax ........... — 0.03 —
Less: Stock-based compensation expense included in
footnote, net of tax .......................... — — (0.13)
Non-GAAP diluted earnings per share .............. $ 1.82 $ 1.87 $ 1.52
Shares used in diluted earnings per share calculation . . . 32,178 32,044 31,651
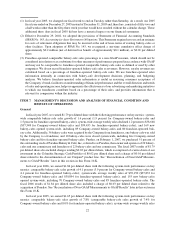
Results of Operations
Fiscal Year 2007 Compared to Fiscal Year 2006
Revenues
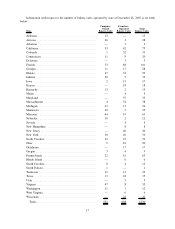
Total revenues for the fiscal year ended December 25, 2007 increased 28.7 percent to $1,066.7 million
compared to $829.0 million for the fiscal year ended December 26, 2006. The growth in total revenue for the fiscal
year ended December 25, 2007 compared to the prior year is primarily due to the opening of 169 new bakery-cafes
system-wide in 2007, the acquisition of 44 system-wide bakery-cafes on February 1, 2007 as a result of the purchase
of 51 percent of the outstanding stock of Paradise, and the increase in system-wide comparable bakery-cafe sales for
the fiscal year ended December 25, 2007 of 1.6 percent.
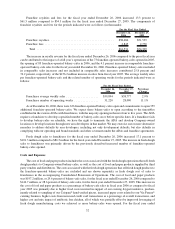
The system-wide average weekly sales per bakery-cafe for the periods indicated are as follows:
December 25,
2007
December 26,
2006
Percentage
Change
For the Fiscal Year Ended
System-wide average weekly sales................... $38,668 $39,150 ⫺1.2%
Average weekly sales is calculated by dividing total net sales by operating weeks. Accordingly, year-over-year
results reflect sales for all locations, whereas comparable store sales exclude closed locations and are based on sales
for bakery-cafes that have been in operation and owned for at least 18 months. New stores typically experience an
opening “honeymoon” period whereby they generate higher average weekly sales during the first 12 to 16 weeks
they are open as customers “settle-in” to normal usage patterns from initial trial of the location. On average, the
“settle-in” experienced is 5 percent to 10 percent from the average weekly sales during the “honeymoon” period. As
a result, year-over-year results of average weekly sales is generally lower than the results in comparable bakery-cafe
sales. This results from the relationship of the number of bakery-cafes in the “honeymoon” phase, the number of
bakery-cafes in the “settle-in” phase, and the number of stores in the comparable store base.
27