Panera Bread 2007 Annual Report Download - page 56
Download and view the complete annual report
Please find page 56 of the 2007 Panera Bread annual report below. You can navigate through the pages in the report by either clicking on the pages listed below, or by using the keyword search tool below to find specific information within the annual report.-
 1
1 -
2
-
3
-
4
-
5
-
6
-
7
-
8
-
9
-
10
-
11
-
12
-
13
-
14
-
15
-
16
-
17
-
18
-
19
-
20
-
21
-
22
-
23
-
24
-
25
-
26
-
27
-
28
-
29
-
30
-
31
-
32
-
33
-
34
-
35
-
36
-
37
-
38
-
39
-
40
-
41
-
42
-
43
-
44
-
45
-
 46
46 -
 47
47 -
 48
48 -
 49
49 -
 50
50 -
 51
51 -
 52
52 -
 53
53 -
 54
54 -
 55
55 -
 56
56 -
 57
57 -
 58
58 -
 59
59 -
 60
60 -
 61
61 -
 62
62 -
 63
63 -
 64
64 -
 65
65 -
 66
66 -
67
-
68
-
69
-
70
-
71
-
72
-
73
-
74
-
75
-
76
-
77
-
78
-
79
-
80
-
81
-
82
-
83
-
84
-
85
-
86
-
87
-
88
-
89
-
90
-
91
-
92
-
93
-
94
-
95
-
96
-
97
-
98
-
99
-
100
 |
 |

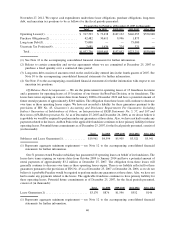
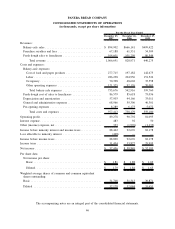
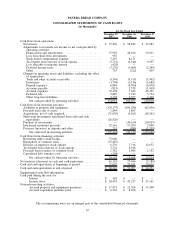
PANERA BREAD COMPANY
CONSOLIDATED STATEMENTS OF OPERATIONS
(in thousands, except per share information)
December 25,
2007
December 26,
2006
December 27,
2005
For the Fiscal Year Ended
Revenues:
Bakery-cafe sales ................................... $ 894,902 $666,141 $499,422
Franchise royalties and fees ........................... 67,188 61,531 54,309
Fresh dough sales to franchisees ........................ 104,601 101,299 86,544
Total revenue .................................. 1,066,691 828,971 640,275
Costs and expenses:
Bakery-cafe expenses:
Cost of food and paper products ...................... 277,715 197,182 142,675
Labor .......................................... 286,238 204,956 151,524
Occupancy ...................................... 70,398 48,602 35,558
Other operating expenses ........................... 121,325 92,176 70,003
Total bakery-cafe expenses ........................ 755,676 542,916 399,760
Fresh dough cost of sales to franchisees .................. 86,579 85,618 75,036
Depreciation and amortization ......................... 57,903 44,166 33,011
General and administrative expenses ..................... 68,966 59,306 46,301
Pre-opening expenses ................................ 8,289 6,173 5,072
Total costs and expenses .......................... 977,413 738,179 559,180
Operating profit ...................................... 89,278 90,792 81,095
Interest expense ...................................... 483 92 50
Other (income) expense, net ............................. 333 (1,976) (1,133)
Income before minority interest and income taxes ............. 88,462 92,676 82,178
Loss allocable to minority interest ........................ (428) — —
Income before income taxes ............................. 88,890 92,676 82,178
Income taxes ........................................ 31,434 33,827 29,995
Net income ......................................... $ 57,456 $ 58,849 $ 52,183
Per share data:
Net income per share:
Basic .......................................... $ 1.81 $ 1.88 $ 1.69
Diluted ......................................... $ 1.79 $ 1.84 $ 1.65
Weighted average shares of common and common equivalent
shares outstanding:
Basic ............................................ 31,708 31,313 30,871
Diluted .......................................... 32,178 32,044 31,651
The accompanying notes are an integral part of the consolidated financial statements.
46