Panera Bread 2007 Annual Report Download - page 27
Download and view the complete annual report
Please find page 27 of the 2007 Panera Bread annual report below. You can navigate through the pages in the report by either clicking on the pages listed below, or by using the keyword search tool below to find specific information within the annual report.-
 1
1 -
2
-
3
-
4
-
5
-
6
-
7
-
8
-
9
-
10
-
11
-
12
-
13
-
14
-
15
-
16
-
 17
17 -
 18
18 -
 19
19 -
 20
20 -
 21
21 -
 22
22 -
 23
23 -
 24
24 -
 25
25 -
 26
26 -
 27
27 -
 28
28 -
 29
29 -
 30
30 -
 31
31 -
 32
32 -
 33
33 -
 34
34 -
 35
35 -
 36
36 -
 37
37 -
38
-
39
-
40
-
41
-
42
-
43
-
44
-
45
-
46
-
47
-
48
-
49
-
50
-
51
-
52
-
53
-
54
-
55
-
56
-
57
-
58
-
59
-
60
-
61
-
62
-
63
-
64
-
65
-
66
-
67
-
68
-
69
-
70
-
71
-
72
-
73
-
74
-
75
-
76
-
77
-
78
-
79
-
80
-
81
-
82
-
83
-
84
-
85
-
86
-
87
-
88
-
89
-
90
-
91
-
92
-
93
-
94
-
95
-
96
-
97
-
98
-
99
-
100
 |
 |

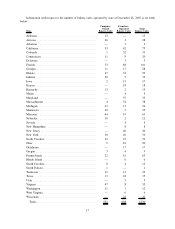
Information with respect to the number of bakery-cafes operated by state at December 25, 2007 is set forth
below:
State
Company-
Owned
Bakery-Cafes
Franchise-
Operated
Bakery-Cafes
Total
Bakery-Cafes
Alabama .................................... 13 — 13
Arizona ..................................... 26 2 28
Arkansas .................................... — 3 3
California ................................... 33 42 75
Colorado .................................... 1 32 33
Connecticut .................................. 11 9 20
Delaware .................................... — 3 3
Florida...................................... 33 68 101
Georgia ..................................... 11 17 28
Illinois ...................................... 67 32 99
Indiana ..................................... 30 5 35
Iowa ....................................... 2 15 17
Kansas...................................... — 18 18
Kentucky .................................... 13 2 15
Maine ...................................... — 4 4
Maryland .................................... — 35 35
Massachusetts ................................ 4 34 38
Michigan .................................... 43 13 56
Minnesota ................................... 22 3 25
Missouri .................................... 44 19 63
Nebraska .................................... 10 2 12
Nevada ..................................... — 4 4
New Hampshire ............................... — 8 8
New Jersey .................................. — 46 46
NewYork ................................... 30 26 56
North Carolina ................................ 12 27 39
Ohio ....................................... 9 81 90
Oklahoma ................................... — 17 17
Oregon ..................................... 5 4 9
Pennsylvania ................................. 22 41 63
Rhode Island ................................. — 6 6
South Carolina ................................ 8 4 12
South Dakota ................................. 1 — 1
Tennessee ................................... 11 12 23
Texas....................................... 13 22 35
Utah ....................................... — 5 5
Virginia ..................................... 47 8 55
Washington .................................. 11 1 12
West Virginia ................................. — 6 6
Wisconsin ................................... — 22 22
Totals..................................... 532 698 1,230
17