Panera Bread 2007 Annual Report Download - page 43
Download and view the complete annual report
Please find page 43 of the 2007 Panera Bread annual report below. You can navigate through the pages in the report by either clicking on the pages listed below, or by using the keyword search tool below to find specific information within the annual report.-
 1
1 -
2
-
3
-
4
-
5
-
6
-
7
-
8
-
9
-
10
-
11
-
12
-
13
-
14
-
15
-
16
-
17
-
18
-
19
-
20
-
21
-
22
-
23
-
24
-
25
-
26
-
27
-
28
-
29
-
30
-
31
-
32
-
 33
33 -
 34
34 -
 35
35 -
 36
36 -
 37
37 -
 38
38 -
 39
39 -
 40
40 -
 41
41 -
 42
42 -
 43
43 -
 44
44 -
 45
45 -
 46
46 -
 47
47 -
 48
48 -
 49
49 -
 50
50 -
 51
51 -
 52
52 -
 53
53 -
54
-
55
-
56
-
57
-
58
-
59
-
60
-
61
-
62
-
63
-
64
-
65
-
66
-
67
-
68
-
69
-
70
-
71
-
72
-
73
-
74
-
75
-
76
-
77
-
78
-
79
-
80
-
81
-
82
-
83
-
84
-
85
-
86
-
87
-
88
-
89
-
90
-
91
-
92
-
93
-
94
-
95
-
96
-
97
-
98
-
99
-
100
 |
 |
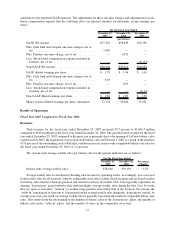
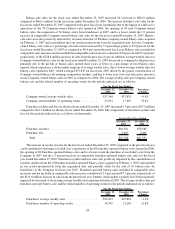
December 26, 2006, there was an average of 50.7 bakery-cafes per fresh dough facility compared to an average of
48.0 for the fiscal year ended December 27, 2005.
Labor expense was $205.0 million, or 30.8 percent of bakery-cafe sales, for the fiscal year ended December 26,
2006 compared to $151.5 million, or 30.3 percent of bakery-cafe sales, for the fiscal year ended December 27, 2005.
The labor expense as a percentage of bakery-cafe sales increased in fiscal year 2006 as compared to fiscal year 2005
primarily as a result of higher bakery-cafe labor costs incurred in support of our evening daypart initiative, partially
offset by leveraging these costs over higher sales volumes.
Occupancy cost was $48.6 million, or 7.3 percent of bakery-cafe sales, for the fiscal year ended December 26,
2006 compared to $35.6 million, or 7.1 percent of bakery-cafe sales, for the fiscal year ended December 27, 2005.
The increase in occupancy cost as a percentage of bakery-cafe sales in fiscal year 2006 compared to fiscal year 2005
was primarily due to higher occupancy costs in certain geographical regions outpacing sales growth related to new
bakery-cafe openings.
Other operating expenses were $92.2 million, or 13.8 percent of bakery-cafe sales, for the fiscal year ended
December 26, 2006 compared to $70.0 million, or 14.0 percent of bakery-cafe sales, for the fiscal year ended
December 27, 2005. The decrease in other operating expenses as a percentage of bakery-cafe sales in fiscal year
2006 compared to fiscal year 2005 was primarily due to the leveraging of other operating costs over higher sales
volumes, partially offset by increased local marketing expenses incurred in support of our evening daypart
initiative.
Fresh dough facility cost of sales to franchisees was $85.6 million, or 84.5 percent of fresh dough facility sales
to franchisees for the fiscal year ended December 26, 2006, compared to $75.0 million, or 86.7 percent of fresh
dough facility sales to franchisees, for the fiscal year ended December 27, 2005. The decrease in the fresh dough
facility cost of sales rate in fiscal year 2006 compared to fiscal year 2005 was primarily due to lower ingredient costs
and improved leveraging of fresh dough manufacturing costs.
General and administrative expenses were $59.3 million, or 7.2 percent of total revenue for the fiscal year
ended December 26, 2006, and $46.3 million, or 7.2 percent of total revenue, for the fiscal year ended December 27,
2005. The increase in the general and administrative expense in fiscal year 2006 compared to fiscal year 2005 was
primarily due to an increase in stock-based compensation costs of $7.4 million primarily related to the adoption of
SFAS No. 123R, increased marketing expenses related to our evening daypart initiative, and higher legal costs
related to litigation that was favorably resolved in the third quarter, partially offset by the leveraging of these costs
over higher sales volumes and lower incentive bonus expense as a result of weaker corporate performance.
Other Income and Expense
Other income and expense for the fiscal year ended December 26, 2006 increased to $2.0 million of income, or
0.2 percent of total revenue, from $1.1 million of income, or 0.2 percent of total revenue, for the fiscal year ended
December 27, 2005. The increase in other income and expense in fiscal year 2006 compared to fiscal year 2005
results primarily from increased interest income in 2006 resulting from higher interest rates, partially offset by
$1.5 million of charges associated with the Paradise acquisition. See Note 3 of our consolidated financial statements
for further information with respect to the charges associated with the Paradise acquisition.
Income Taxes
The provision for income taxes increased to $33.8 million for the fiscal year ended December 26, 2006
compared to $30.0 million for the fiscal year ended December 27, 2005. The provision for income taxes for the
fiscal years ended December 26, 2006 and December 27, 2005 reflected a consistent combined federal, state, and
local effective tax rate of 36.5 percent.
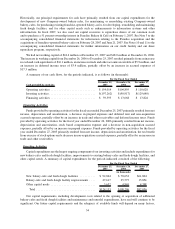
Liquidity and Capital Resources
Cash and cash equivalents were $68.2 million at December 25, 2007, compared with $52.1 million at
December 26, 2006. Our primary source of liquidity is cash provided by operations, although we also borrowed
under a new credit facility in the fourth quarter of 2007 primarily to finance our share repurchase program.
33