OfficeMax 2007 Annual Report Download - page 48
Download and view the complete annual report
Please find page 48 of the 2007 OfficeMax annual report below. You can navigate through the pages in the report by either clicking on the pages listed below, or by using the keyword search tool below to find specific information within the annual report.-
 1
1 -
2
-
3
-
4
-
5
-
6
-
7
-
8
-
9
-
10
-
11
-
12
-
13
-
14
-
15
-
16
-
17
-
18
-
19
-
20
-
21
-
22
-
23
-
24
-
25
-
26
-
27
-
28
-
29
-
30
-
31
-
32
-
33
-
34
-
35
-
36
-
37
-
 38
38 -
 39
39 -
 40
40 -
 41
41 -
 42
42 -
 43
43 -
 44
44 -
 45
45 -
 46
46 -
 47
47 -
 48
48 -
 49
49 -
 50
50 -
 51
51 -
 52
52 -
 53
53 -
 54
54 -
 55
55 -
 56
56 -
 57
57 -
 58
58 -
59
-
60
-
61
-
62
-
63
-
64
-
65
-
66
-
67
-
68
-
69
-
70
-
71
-
72
-
73
-
74
-
75
-
76
-
77
-
78
-
79
-
80
-
81
-
82
-
83
-
84
-
85
-
86
-
87
-
88
-
89
-
90
-
91
-
92
-
93
-
94
-
95
-
96
-
97
-
98
-
99
-
100
-
101
-
102
-
103
-
104
-
105
-
106
-
107
-
108
-
109
-
110
-
111
-
112
-
113
-
114
-
115
-
116
-
117
-
118
-
119
-
120
-
121
-
122
-
123
-
124
 |
 |

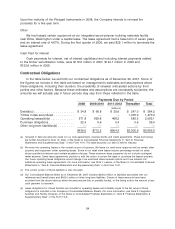
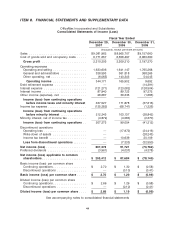
ITEM 8. FINANCIAL STATEMENTS AND SUPPLEMENTARY DATA
OfficeMax Incorporated and Subsidiaries
Consolidated Statements of Income (Loss)
Fiscal Year Ended
December 29, December 30, December 31,
2007 2006 2005
(thousands, except per-share amounts)
Sales ............................... $9,081,962 $ 8,965,707 $ 9,157,660
Cost of goods sold and occupancy costs ..... 6,771,657 6,656,497 6,960,390
Gross profit ........................ 2,310,305 2,309,210 2,197,270
Operating expenses
Operating and selling .................. 1,633,606 1,641,147 1,765,268
General and administrative .............. 338,593 361,818 368,265
Other operating, net ................... (6,065) 140,343 54,045
Operating income .................. 344,171 165,902 9,692
Debt retirement expense ................. — — (14,391)
Interest expense ....................... (121,271) (123,082) (128,504)
Interest income ........................ 87,940 89,723 97,272
Other income (expense), net .............. 26,687 39,335 (1,685)
Income (loss) from continuing operations
before income taxes and minority interest 337,527 171,878 (37,616)
Income tax expense ..................... (125,282) (68,741) (1,226)
Income (loss) from continuing operations
before minority interest .............. 212,245 103,137 (38,842)
Minority interest, net of income tax .......... (4,872) (4,083) (2,370)
Income (loss) from continuing operations . . 207,373 99,054 (41,212)
Discontinued operations
Operating loss ....................... — (17,972) (24,416)
Write-down of assets .................. — — (28,243)
Income tax benefit .................... — 10,639 20,109
Loss from discontinued operations ....... — (7,333) (32,550)
Net income (loss) ...................... 207,373 91,721 (73,762)
Preferred dividends ..................... (3,961) (4,037) (4,378)
Net income (loss) applicable to common
shareholders ........................ $ 203,412 $ 87,684 $ (78,140)
Basic income (loss) per common share
Continuing operations .................. $ 2.70 $ 1.30 $ (0.58)
Discontinued operations ................ — (0.10) (0.41)
Basic income (loss) per common share ..... $ 2.70 $ 1.20 $ (0.99)
Diluted income (loss) per common share
Continuing operations .................. $ 2.66 $ 1.29 $ (0.58)
Discontinued operations ................ — (0.10) (0.41)
Diluted income (loss) per common share .... $ 2.66 $ 1.19 $ (0.99)
See accompanying notes to consolidated financial statements
44