OfficeMax 2007 Annual Report Download - page 29
Download and view the complete annual report
Please find page 29 of the 2007 OfficeMax annual report below. You can navigate through the pages in the report by either clicking on the pages listed below, or by using the keyword search tool below to find specific information within the annual report.-
 1
1 -
2
-
3
-
4
-
5
-
6
-
7
-
8
-
9
-
10
-
11
-
12
-
13
-
14
-
15
-
16
-
17
-
18
-
 19
19 -
 20
20 -
 21
21 -
 22
22 -
 23
23 -
 24
24 -
 25
25 -
 26
26 -
 27
27 -
 28
28 -
 29
29 -
 30
30 -
 31
31 -
 32
32 -
 33
33 -
 34
34 -
 35
35 -
 36
36 -
 37
37 -
 38
38 -
 39
39 -
40
-
41
-
42
-
43
-
44
-
45
-
46
-
47
-
48
-
49
-
50
-
51
-
52
-
53
-
54
-
55
-
56
-
57
-
58
-
59
-
60
-
61
-
62
-
63
-
64
-
65
-
66
-
67
-
68
-
69
-
70
-
71
-
72
-
73
-
74
-
75
-
76
-
77
-
78
-
79
-
80
-
81
-
82
-
83
-
84
-
85
-
86
-
87
-
88
-
89
-
90
-
91
-
92
-
93
-
94
-
95
-
96
-
97
-
98
-
99
-
100
-
101
-
102
-
103
-
104
-
105
-
106
-
107
-
108
-
109
-
110
-
111
-
112
-
113
-
114
-
115
-
116
-
117
-
118
-
119
-
120
-
121
-
122
-
123
-
124
 |
 |

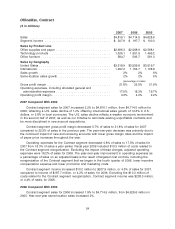
Contract segment gross profit margin improved by 0.6% of sales to 22.5% of sales for 2006
compared to 21.9% of sales in the previous year. The year-over-year increase resulted from a
continued focus on the middle-market and other higher margin sales opportunities.
Operating expenses for the Contract segment decreased by 1.4% of sales to 18.3% of sales for
2006 from 19.7% of sales a year earlier. Fiscal year 2006 includes $10.3 million of costs related to
the Contract segment reorganization. Fiscal year 2005 includes a $9.8 million pre-tax charge for a
legal settlement with the Department of Justice and a $5.4 million pre-tax charge related to the
restructuring of our international operations. Excluding the impact of these charges, operating
expenses were 18.2% and 19.4% of sales for 2006 and 2005, respectively. The year-over-year
improvement in operating expenses as a percentage of sales is due to lower promotion and
marketing costs as well as reduced payroll and integration expenses.
Contract segment income increased $97.4 million to $197.7 million, or 4.2% of sales, for 2006,
compared to income of $100.3 million, or 2.2% of sales, for 2005. Excluding the $10.3 million of
costs related to the Contract segment reorganization, adjusted Contract segment income was
$208.0 million, or 4.4% of sales, for 2006. Excluding the $9.8 million legal settlement with the
Department of Justice and the $5.4 million of international restructuring charges, adjusted Contract
segment income was $115.5 million, or 2.5% of sales, for 2005.
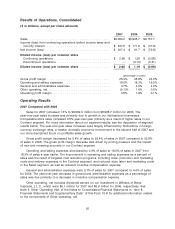
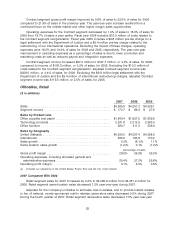
OfficeMax, Retail
($ in millions)
2007 2006 2005
Sales ............................................. $4,265.9 $4,251.2 $4,529.1
Segment income .................................... $ 173.7 $ 86.3 $ 27.9
Sales by Product Line
Office supplies and paper .............................. $1,640.4 $1,627.5 $1,639.6
Technology products ................................. 2,241.8 2,212.5 2,363.5
Office furniture ...................................... 383.7 411.2 526.0
Sales by Geography
United States(a) ..................................... $4,030.0 $4,057.4 $4,358.9
International ........................................ 235.9 193.8 170.2
Sales growth ....................................... 0.3% (6.1)% 1.1%
Same-location sales growth ............................. (1.2)% 0.1% (1.0)%
(percentage of sales)
Gross profit margin ................................... 29.5% 29.3% 26.2%
Operating expenses, including allocated general and
administrative expenses .............................. 25.4% 27.3% 25.6%
Operating profit margin ................................ 4.1% 2.0% 0.6%
(a) Includes our operations in the United States, Puerto Rico and the U.S. Virgin Islands.
2007 Compared With 2006
Retail segment sales for 2007 increased by 0.3% to $4,265.9 million from $4,251.2 million for
2006. Retail segment same-location sales decreased 1.2% year-over-year during 2007.
Adjusted for the Company’s initiative to eliminate mail-in rebates, and to provide instant rebates
in lieu of national, vendor-sponsored mail-in rebates, same-store sales decreased 0.5% during 2007.
During the fourth quarter of 2007, Retail segment same-store sales decreased 7.3% year-over-year
25