OfficeMax 2007 Annual Report Download - page 28
Download and view the complete annual report
Please find page 28 of the 2007 OfficeMax annual report below. You can navigate through the pages in the report by either clicking on the pages listed below, or by using the keyword search tool below to find specific information within the annual report.-
 1
1 -
2
-
3
-
4
-
5
-
6
-
7
-
8
-
9
-
10
-
11
-
12
-
13
-
14
-
15
-
16
-
17
-
 18
18 -
 19
19 -
 20
20 -
 21
21 -
 22
22 -
 23
23 -
 24
24 -
 25
25 -
 26
26 -
 27
27 -
 28
28 -
 29
29 -
 30
30 -
 31
31 -
 32
32 -
 33
33 -
 34
34 -
 35
35 -
 36
36 -
 37
37 -
 38
38 -
39
-
40
-
41
-
42
-
43
-
44
-
45
-
46
-
47
-
48
-
49
-
50
-
51
-
52
-
53
-
54
-
55
-
56
-
57
-
58
-
59
-
60
-
61
-
62
-
63
-
64
-
65
-
66
-
67
-
68
-
69
-
70
-
71
-
72
-
73
-
74
-
75
-
76
-
77
-
78
-
79
-
80
-
81
-
82
-
83
-
84
-
85
-
86
-
87
-
88
-
89
-
90
-
91
-
92
-
93
-
94
-
95
-
96
-
97
-
98
-
99
-
100
-
101
-
102
-
103
-
104
-
105
-
106
-
107
-
108
-
109
-
110
-
111
-
112
-
113
-
114
-
115
-
116
-
117
-
118
-
119
-
120
-
121
-
122
-
123
-
124
 |
 |

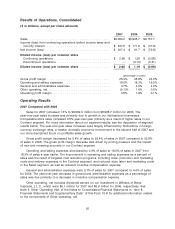
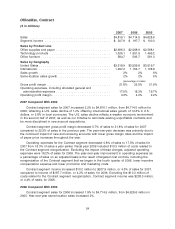
OfficeMax, Contract
($ in millions)
2007 2006 2005
Sales ............................................. $4,816.1 $4,714.5 $4,628.6
Segment income .................................... $ 207.9 $ 197.7 $ 100.3
Sales by Product Line
Office supplies and paper .............................. $2,696.3 $2,568.9 $2,598.1
Technology products ................................. 1,535.1 1,551.9 1,469.2
Office furniture ...................................... 584.7 593.7 561.3
Sales by Geography
United States ....................................... $3,518.9 $3,559.8 $3,519.7
International ........................................ 1,297.2 1,154.7 1,108.9
Sales growth ....................................... 2% 2% 6%
Same-location sales growth ............................. 2% 2% 5%
(percentage of sales)
Gross profit margin ................................... 21.8% 22.5% 21.9%
Operating expenses, including allocated general and
administrative expenses .............................. 17.5% 18.3% 19.7%
Operating profit margin ................................ 4.3% 4.2% 2.2%
2007 Compared With 2006
Contract segment sales for 2007 increased 2.2% to $4,816.1 million, from $4,714.5 million for
2006, reflecting a U.S. sales decline of 1.2% offset by international sales growth of 12.3% in U.S.
dollars, or 2.8% in local currencies. The U.S. sales decline reflects a weaker economic environment
in the second half of 2007, as well as our initiative to terminate existing unprofitable contracts and
be more disciplined in new account acquisitions.
Contract segment gross profit margin decreased 0.7% of sales to 21.8% of sales for 2007
compared to 22.5% of sales in the previous year. The year-over-year decrease was primarily due to
the continued impact of new and renewing accounts with lower gross margin rates and the impact
of paper price increases throughout the year.
Operating expenses for the Contract segment decreased 0.8% of sales to 17.5% of sales for
2007 from 18.3% of sales a year earlier. Fiscal year 2006 included $10.3 million of costs related to
the Contract segment reorganization. Excluding the impact of these charges, adjusted operating
expenses were 18.2% of sales for 2006. The year-over-year improvement in operating expenses as
a percentage of sales on an adjusted basis is the result of targeted cost controls, including the
reorganization of the Contract segment that we began in the fourth quarter of 2006, lower incentive
compensation expense and lower promotion and marketing costs.
Contract segment income increased $10.2 million to $207.9 million, or 4.3% of sales for 2007,
compared to income of $197.7 million, or 4.2% of sales, for 2006. Excluding the $10.3 million of
costs related to the Contract segment reorganization, Contract segment income was $208.0 million,
or 4.4% of sales, for 2006.
2006 Compared With 2005
Contract segment sales for 2006 increased 1.9% to $4,714.5 million, from $4,628.6 million in
2005. Year-over-year same-location sales increased 2%.
24