OfficeMax 2007 Annual Report Download - page 24
Download and view the complete annual report
Please find page 24 of the 2007 OfficeMax annual report below. You can navigate through the pages in the report by either clicking on the pages listed below, or by using the keyword search tool below to find specific information within the annual report.-
 1
1 -
2
-
3
-
4
-
5
-
6
-
7
-
8
-
9
-
10
-
11
-
12
-
13
-
 14
14 -
 15
15 -
 16
16 -
 17
17 -
 18
18 -
 19
19 -
 20
20 -
 21
21 -
 22
22 -
 23
23 -
 24
24 -
 25
25 -
 26
26 -
 27
27 -
 28
28 -
 29
29 -
 30
30 -
 31
31 -
 32
32 -
 33
33 -
 34
34 -
35
-
36
-
37
-
38
-
39
-
40
-
41
-
42
-
43
-
44
-
45
-
46
-
47
-
48
-
49
-
50
-
51
-
52
-
53
-
54
-
55
-
56
-
57
-
58
-
59
-
60
-
61
-
62
-
63
-
64
-
65
-
66
-
67
-
68
-
69
-
70
-
71
-
72
-
73
-
74
-
75
-
76
-
77
-
78
-
79
-
80
-
81
-
82
-
83
-
84
-
85
-
86
-
87
-
88
-
89
-
90
-
91
-
92
-
93
-
94
-
95
-
96
-
97
-
98
-
99
-
100
-
101
-
102
-
103
-
104
-
105
-
106
-
107
-
108
-
109
-
110
-
111
-
112
-
113
-
114
-
115
-
116
-
117
-
118
-
119
-
120
-
121
-
122
-
123
-
124
 |
 |

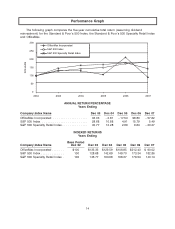
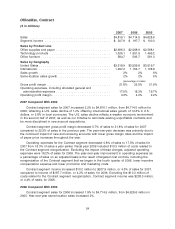
Results of Operations, Consolidated
($ in millions, except per share amounts)
2007 2006 2005
Sales ............................................. $9,082.0 $8,965.7 $9,157.7
Income (loss) from continuing operations before income taxes and
minority interest ................................... $ 337.5 $ 171.9 $ (37.6)
Net income (loss) .................................... $ 207.4 $ 91.7 $ (73.8)
Diluted income (loss) per common share
Continuing operations ............................... $ 2.66 $ 1.29 $ (0.58)
Discontinued operations ............................. — (0.10) (0.41)
Diluted income (loss) per common share ................. $ 2.66 $ 1.19 $ (0.99)
(percentage of sales)
Gross profit margin ................................... 25.4% 25.8% 24.0%
Operating and selling expenses .......................... 18.0% 18.3% 19.3%
General and administrative expenses ...................... 3.7% 4.0% 4.0%
Other operating, net .................................. (0.1)% 1.6% 0.6%
Operating profit margin ................................ 3.8% 1.9% 0.1%
Operating Results
2007 Compared with 2006
Sales for 2007 increased 1.3% to $9,082.0 million from $8,965.7 million for 2006. The
year-over-year sales increase was primarily due to growth in our international businesses.
Comparable-store sales increased 0.5% year-over-year primarily as a result of higher sales in our
Contract segment. For more information about our segment results, see the discussion of segment
results below. The year-over-year sales increases were largely influenced by fluctuations in foreign
currency exchange rates, a weaker domestic economic environment in the second half of 2007 and
our more disciplined focus on profitable sales growth.
Gross profit margin decreased by 0.4% of sales to 25.4% of sales in 2007 compared to 25.8%
of sales in 2006. The gross profit margin decrease was driven by pricing pressure and the impact
of new and renewing accounts in our Contract segment.
Operating and selling expenses decreased by 0.3% of sales to 18.0% of sales in 2007 from
18.3% of sales a year earlier. The improvement in operating and selling expenses as a percent of
sales was the result of targeted cost reduction programs, including lower promotion and marketing
costs and delivery expenses in the Contract segment, and reduced store labor and marketing costs
in the Retail segment, as well as reduced incentive compensation expense.
General and administrative expenses were 3.7% of sales for 2007 compared to 4.0% of sales
for 2006. The year-over-year decrease in general and administrative expenses as a percentage of
sales was due primarily to a decrease in incentive compensation expense.
Other operating, net includes dividends earned on our investment in affiliates of Boise
Cascade, L.L.C., which were $6.1 million for 2007 and $5.9 million for 2006, respectively. See
Note 5, Other Operating, Net, of the Notes to Consolidated Financial Statements in ‘‘Item 8.
Financial Statements and Supplementary Data’’ of this Form 10-K for additional information related
to the components of Other operating, net.
20