Nike 2013 Annual Report Download - page 77
Download and view the complete annual report
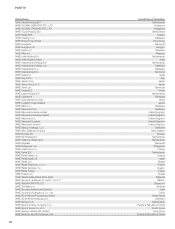
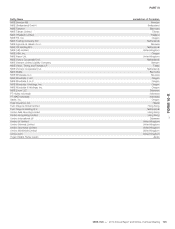
Please find page 77 of the 2013 Nike annual report below. You can navigate through the pages in the report by either clicking on the pages listed below, or by using the keyword search tool below to find specific information within the annual report.-
 1
1 -
2
-
3
-
4
-
5
-
6
-
7
-
8
-
9
-
10
-
11
-
12
-
13
-
14
-
15
-
16
-
17
-
18
-
19
-
20
-
21
-
22
-
23
-
24
-
25
-
26
-
27
-
28
-
29
-
30
-
31
-
32
-
33
-
34
-
35
-
36
-
37
-
38
-
39
-
40
-
41
-
42
-
43
-
44
-
45
-
46
-
47
-
48
-
49
-
50
-
51
-
52
-
53
-
54
-
55
-
56
-
57
-
58
-
59
-
60
-
61
-
62
-
63
-
64
-
65
-
66
-
 67
67 -
 68
68 -
 69
69 -
 70
70 -
 71
71 -
 72
72 -
 73
73 -
 74
74 -
 75
75 -
 76
76 -
 77
77 -
 78
78 -
 79
79 -
 80
80 -
 81
81 -
 82
82 -
 83
83 -
 84
84
 |
 |

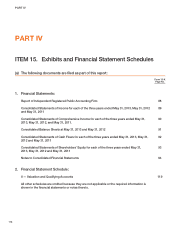
PART IV
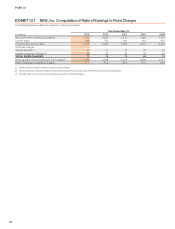
EXHIBIT 12.1 NIKE, Inc. Computation of Ratio of Earnings to Fixed Charges
The following disclosure reflects the company’s continuing operations:
Year Ended May 31,
(in millions) 2013 2012 2011 2010 2009
Net income from continuing operations 2,464 2,269 2,172 1,923 1,754
Income taxes 808 756 690 614 652
Income before income taxes 3,272 3,025 2,862 2,537 2,406
Add fixed charges
Interest expense(1) 23 31 32 33 39
Interest component of leases(2) 48 42 39 36 34
TOTAL FIXED CHARGES 71 73 71 69 73
Earnings before income taxes and fixed charges(3) 3,343 3,098 2,933 2,606 2,479
Ratio of earnings to total fixed charges 47.1 42.4 41.3 37.8 34.0
(1) Interest expense includes interest both expensed and capitalized.
(2) Interest component of leases includes one-tenth of rental expense which approximates the interest component of operating leases.
(3) Earnings before income taxes and fixed charges are exclusive of capitalized interest.
122