Nike 2013 Annual Report Download - page 28
Download and view the complete annual report
Please find page 28 of the 2013 Nike annual report below. You can navigate through the pages in the report by either clicking on the pages listed below, or by using the keyword search tool below to find specific information within the annual report.-
 1
1 -
2
-
3
-
4
-
5
-
6
-
7
-
8
-
9
-
10
-
11
-
12
-
13
-
14
-
15
-
16
-
17
-
 18
18 -
 19
19 -
 20
20 -
 21
21 -
 22
22 -
 23
23 -
 24
24 -
 25
25 -
 26
26 -
 27
27 -
 28
28 -
 29
29 -
 30
30 -
 31
31 -
 32
32 -
 33
33 -
 34
34 -
 35
35 -
 36
36 -
 37
37 -
 38
38 -
39
-
40
-
41
-
42
-
43
-
44
-
45
-
46
-
47
-
48
-
49
-
50
-
51
-
52
-
53
-
54
-
55
-
56
-
57
-
58
-
59
-
60
-
61
-
62
-
63
-
64
-
65
-
66
-
67
-
68
-
69
-
70
-
71
-
72
-
73
-
74
-
75
-
76
-
77
-
78
-
79
-
80
-
81
-
82
-
83
-
84
 |
 |

PART II
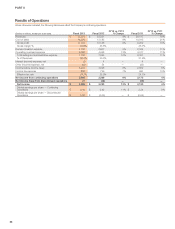
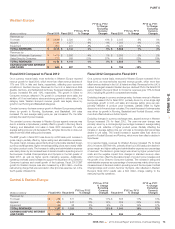
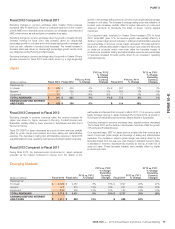
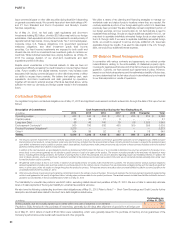
Western Europe
(Dollars in millions) Fiscal 2013 Fiscal 2012
FY13 vs. FY12
% Change
FY13 vs. FY12
% Change
Excluding
Currency
Changes Fiscal 2011
FY12 vs. FY11
% Change
FY12 vs. FY11
% Change
Excluding
Currency
Changes
Revenues by:
Footwear $ 2,646 $ 2,526 5% 10% $ 2,345 8% 5%
Apparel 1,261 1,377 -8% -4% 1,303 6% 2%
Equipment 221 241 -8% -3% 220 10% 5%
TOTAL REVENUES $ 4,128 $ 4,144 0% 5% $ 3,868 7% 4%
Revenues by:
Sales to Wholesale Customers $ 3,416 $ 3,556 -4% 1% $ 3,385 5% 2%
Sales Direct to Consumer 712 588 21% 27% 483 22% 18%
TOTAL REVENUES $ 4,128 $ 4,144 0% 5% $ 3,868 7% 4%
EARNINGS BEFORE INTEREST
AND TAXES $ 640 $ 597 7% $ 730 -18%
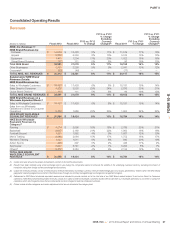
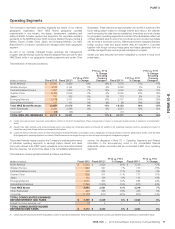
Fiscal 2013 Compared to Fiscal 2012
On a currency neutral basis, most territories in Western Europe reported
revenue growth for fiscal 2013, which more than offset revenue declines of
17% and 18% in Italy and Iberia, respectively, reflecting poor economic
conditions in Southern Europe. Revenues for the U.K. & Ireland and AGS
(Austria, Germany, and Switzerland) territories, the largest markets in Western
Europe, increased 8% and 12%, respectively. The growth in Direct to
Consumer revenues reflected 17% growth in comparable store sales, the
addition of 19 net new factory stores and strong growth in online sales. On a
category basis, Western Europe’s revenue growth was largely driven by
growth in our Running and Basketball categories.
Constant currency footwear revenue growth in Western Europe was primarily
driven by growth in Running, Sportswear, and Basketball. Unit sales
increased 7% and average selling price per pair increased 3%, the latter
primarily the result of price increases.
The constant currency decrease in Western Europe apparel revenues was
due to a decline in Sportswear, partially offset by growth in Running, Men’s
Training, and Basketball. Unit sales in fiscal 2013 decreased 1% while
average selling price per unit decreased 3%, as higher discounts on close-out
sales more than offset selling price increases.
The EBIT growth in fiscal 2013 was driven by a 200 basis point increase in
gross margin, partially offset by higher selling and administrative expenses.
The gross margin increase was primarily driven by favorable standard foreign
currency exchange rates; higher net average selling prices were mostly offset
by higher product costs. The increase in selling and administrative expense
was mainly driven by an increased level of demand creation spending around
the European Football Championships and Olympics in the first quarter of
fiscal 2013, as well as higher sports marketing expense. Additionally,
operating overhead costs increased to support the expansion of our Direct to
Consumer business and overall growth of the business. Fiscal 2013 EBIT
growth for Western Europe was also increased by a $24 million, one-time
restructuring charge that was recorded in other (income) expense, net, in the
fourth quarter of fiscal 2012.
Fiscal 2012 Compared to Fiscal 2011
On a currency neutral basis, revenues for Western Europe increased 4% for
fiscal 2012, as most territories reported revenue growth, which more than
offset revenue declines in the U.K. & Ireland and Italy. Revenues for the U.K. &
Ireland, the largest market in Western Europe, declined 3% for the fiscal 2012
period. Western Europe’s Direct to Consumer revenues grew 18% for fiscal
2012, including 8% growth in comparable store sales.
Excluding changes in currency exchange rates, footwear revenue in Western
Europe increased 5% for fiscal 2012, primarily driven by a low-single-digit
percentage growth in both unit sales and average selling price per pair,
primarily reflective of product price increases, partially offset by higher
discounts on in-line and close-out sales. The overall increase in footwear sales
was driven by growth in Running, Basketball and Football (Soccer), which
more than offset a decline in Action Sports.
Excluding changes in currency exchange rates, apparel revenue in Western
Europe increased 2% for fiscal 2012. The year-over-year change was
primarily driven by a mid-single-digit percentage increase in average selling
price per unit, reflective of higher product prices. Partially offsetting the
increase in average selling price per unit was a mid-single-digit percentage
decline in unit sales. The overall increase in apparel sales was driven by
growth in Football (Soccer) and Running, which more than offset a decline in
Sportswear.
On a reported basis, revenues for Western Europe increased 7% for fiscal
2012. However, EBIT fell 18%, primarily driven by a 350 basis point decline in
gross margin and higher selling and administrative expense as a percentage
of revenues. The decline in gross margin was driven by higher product input
costs and the negative impact from changes in standard currency rates,
which more than offset the favorable impact of product price increases and
the growth of our Direct to Consumer business. The increase in selling and
administrative expense as a percentage of revenues was mainly driven by an
increased level of demand creation spending around the European Football
Championships and London Summer Olympics. Also reflected in Western
Europe’s fiscal 2012 results was a $24 million charge relating to the
restructuring of its operations.
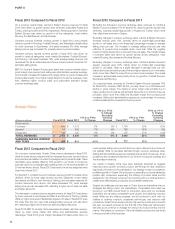
Central & Eastern Europe
(Dollars in millions) Fiscal 2013 Fiscal 2012
FY13 vs. FY12
% Change
FY13 vs. FY12
% Change
Excluding
Currency
Changes Fiscal 2011
FY12 vs. FY11
% Change
FY12 vs. FY11
% Change
Excluding
Currency
Changes
Revenues by:
Footwear $ 714 $ 671 6% 11% $ 605 11% 13%
Apparel 483 441 10% 14% 359 23% 24%
Equipment 90 88 2% 9% 76 16% 17%
TOTAL REVENUES $ 1,287 $ 1,200 7% 12% $ 1,040 15% 17%
EARNINGS BEFORE INTEREST
AND TAXES $ 259 $ 234 11% $ 244 -4%
NIKE, INC. 2013 Annual Report and Notice of Annual Meeting 73
FORM 10-K