Nike 2013 Annual Report Download - page 26
Download and view the complete annual report
Please find page 26 of the 2013 Nike annual report below. You can navigate through the pages in the report by either clicking on the pages listed below, or by using the keyword search tool below to find specific information within the annual report.-
 1
1 -
2
-
3
-
4
-
5
-
6
-
7
-
8
-
9
-
10
-
11
-
12
-
13
-
14
-
15
-
 16
16 -
 17
17 -
 18
18 -
 19
19 -
 20
20 -
 21
21 -
 22
22 -
 23
23 -
 24
24 -
 25
25 -
 26
26 -
 27
27 -
 28
28 -
 29
29 -
 30
30 -
 31
31 -
 32
32 -
 33
33 -
 34
34 -
 35
35 -
 36
36 -
37
-
38
-
39
-
40
-
41
-
42
-
43
-
44
-
45
-
46
-
47
-
48
-
49
-
50
-
51
-
52
-
53
-
54
-
55
-
56
-
57
-
58
-
59
-
60
-
61
-
62
-
63
-
64
-
65
-
66
-
67
-
68
-
69
-
70
-
71
-
72
-
73
-
74
-
75
-
76
-
77
-
78
-
79
-
80
-
81
-
82
-
83
-
84
 |
 |
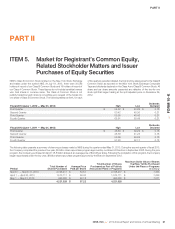
PART II
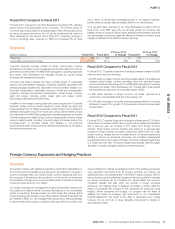
Operating Segments
The Company’s reportable operating segments are based on our internal
geographic organization. Each NIKE Brand geography operates
predominantly in one industry: the design, development, marketing and
selling of athletic footwear, apparel, and equipment. Our reportable operating
segments for the NIKE Brand are: North America, Western Europe, Central &
Eastern Europe, Greater China, Japan, and Emerging Markets. Our NIKE
Brand Direct to Consumer operations are managed within each geographic
segment.
As part of our centrally managed foreign exchange risk management
program, standard foreign currency rates are assigned twice per year to each
NIKE Brand entity in our geographic operating segments and certain Other
Businesses. These rates are set approximately nine months in advance of the
future selling season based on average market spot rates in the calendar
month preceding the date they are established. Inventories and cost of sales
for geographic operating segments and certain Other Businesses reflect use
of these standard rates to record non-functional currency product purchases
into the entity’s functional currency. Differences between assigned standard
foreign currency rates and actual market rates are included in Corporate
together with foreign currency hedge gains and losses generated from our
centrally managed foreign exchange risk management program.
Certain prior year amounts have been reclassified to conform to fiscal 2013
presentation.
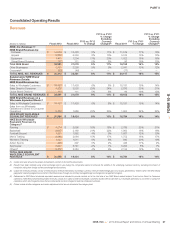
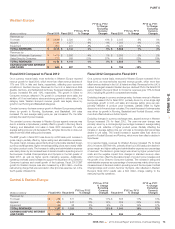
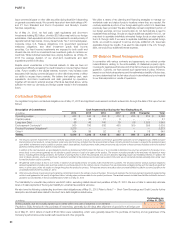
Thebreakdownofrevenuesisasfollows:
(Dollars in millions) Fiscal 2013 Fiscal 2012(1)
FY13 vs. FY12
% Change
FY13 vs. FY12
% Change
Excluding
Currency
Changes(2) Fiscal 2011(1)
FY12 vs. FY11
% Change
FY12 vs. FY11
% Change
Excluding
Currency
Changes(2)
North America $ 10,387 $ 8,839 18% 18% $ 7,579 17% 17%
Western Europe 4,128 4,144 0% 5% 3,868 7% 4%
Central & Eastern Europe 1,287 1,200 7% 12% 1,040 15% 17%
Greater China 2,453 2,539 -3% -5% 2,060 23% 18%
Japan 791 835 -5% 1% 773 8% 1%
Emerging Markets 3,718 3,411 9% 16% 2,737 25% 26%
Global Brand Divisions 117 111 5% 8% 96 16% 13%
Total NIKE Brand Revenues 22,881 21,079 9% 11% 18,153 16% 15%
Other Businesses 2,500 2,298 9% 9% 2,041 13% 12%
Corporate(3) (68) (46) — — (77) — —
TOTAL NIKE, INC. REVENUES $ 25,313 $ 23,331 8% 11% $ 20,117 16% 15%
(1) Certain prior year amounts have been reclassified to conform to fiscal 2013 presentation. These changes had no impact on previously reported results of operations or shareholders’
equity.
(2) Results have been restated using actual exchange rates in use during the comparative period to enhance the visibility of the underlying business trends by excluding the impact of
translation arising from foreign currency exchange rate fluctuations.
(3) Corporate revenues primarily consist of certain intercompany revenue eliminations and foreign currency hedge gains and losses related to revenues generated by entities within the NIKE
Brand geographic operating segments and certain Other Businesses but managed through our central foreign exchange risk management program.
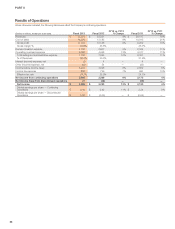
The primary financial measure used by the Company to evaluate performance
of individual operating segments is earnings before interest and taxes
(commonly referred to as “EBIT”) which represents net income before interest
(income) expense, net and income taxes in the consolidated statements of
income. As discussed in Note 18 — Operating Segments and Related
Information in the accompanying notes to the consolidated financial
statements, certain corporate costs are not included in EBIT of our operating
segments.
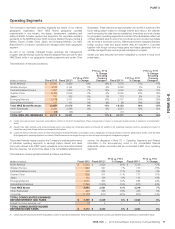
The breakdown of earnings before interest and taxes is as follows:
(Dollars in millions) Fiscal 2013 Fiscal 2012(1)
FY13 vs. FY12
% Change Fiscal 2011(1)
FY12 vs. FY11
% Change
North America $ 2,534 $ 2,030 25% $ 1,736 17%
Western Europe 640 597 7% 730 -18%
Central & Eastern Europe 259 234 11% 244 -4%
Greater China 809 911 -11% 777 17%
Japan 133 136 -2% 114 19%
Emerging Markets 1,011 853 19% 688 24%
Global Brand Divisions (1,396) (1,200) -16% (971) -24%
Total NIKE Brand 3,990 3,561 12% 3,318 7%
Other Businesses 456 385 18% 353 9%
Corporate (1,177) (917) -28% (805) -14%
TOTAL CONSOLIDATED EARNINGS
BEFORE INTEREST AND TAXES $ 3,269 $ 3,029 8% $ 2,866 6%
Interest (income) expense, net (3) 4 — 4 —
TOTAL CONSOLIDATED INCOME
BEFORE INCOME TAXES $ 3,272 $ 3,025 8% $ 2,862 6%
(1) Certain prior year amounts have been reclassified to conform to fiscal 2013 presentation. These changes had no impact on previously reported results of operations or shareholders’ equity.
NIKE, INC. 2013 Annual Report and Notice of Annual Meeting 71
FORM 10-K