Nike 2013 Annual Report Download - page 31
Download and view the complete annual report
Please find page 31 of the 2013 Nike annual report below. You can navigate through the pages in the report by either clicking on the pages listed below, or by using the keyword search tool below to find specific information within the annual report.-
 1
1 -
2
-
3
-
4
-
5
-
6
-
7
-
8
-
9
-
10
-
11
-
12
-
13
-
14
-
15
-
16
-
17
-
18
-
19
-
20
-
 21
21 -
 22
22 -
 23
23 -
 24
24 -
 25
25 -
 26
26 -
 27
27 -
 28
28 -
 29
29 -
 30
30 -
 31
31 -
 32
32 -
 33
33 -
 34
34 -
 35
35 -
 36
36 -
 37
37 -
 38
38 -
 39
39 -
 40
40 -
 41
41 -
42
-
43
-
44
-
45
-
46
-
47
-
48
-
49
-
50
-
51
-
52
-
53
-
54
-
55
-
56
-
57
-
58
-
59
-
60
-
61
-
62
-
63
-
64
-
65
-
66
-
67
-
68
-
69
-
70
-
71
-
72
-
73
-
74
-
75
-
76
-
77
-
78
-
79
-
80
-
81
-
82
-
83
-
84
 |
 |

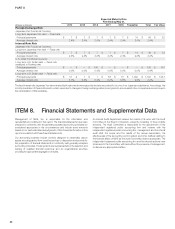
PART II
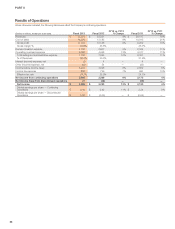
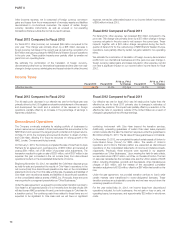
Fiscal 2013 Compared to Fiscal 2012
For fiscal 2013, constant currency revenue growth for the Emerging Markets
geography was driven by growth in every key category and every territory, led
by Argentina, Brazil, and Mexico.
Constant currency footwear revenue growth for fiscal 2013 was driven by
growth in most key categories, most notably Running, Football (Soccer), and
Women’s Training. Unit sales increased approximately 9% and average
selling price per pair increased 6%, primarily driven by selling price increases.
Fiscal 2013 constant currency apparel revenue was driven by growth in every
key category, led by Football (Soccer), Running, Sportswear, and Men’s
Training. Unit sales increased approximately 10% and average selling price
per unit increased 9%, largely attributable to price increases.
Fiscal 2013 Emerging Markets EBIT grew faster than revenue primarily driven
by gross margin improvement, partially offset by higher selling and
administrative expense as a percent of revenue. Gross margin increased 260
basis points due largely to the favorable impact of price increases, the
anniversary of a one-time custom duty charge in fiscal 2012, and favorable
standard foreign currency exchange rates, which more than offset the
unfavorable impact of higher product costs. As a percent of revenue, selling
and administrative expense was higher due to higher operating overhead
costs to support the expansion of our Direct to Consumer business and
overall growth of the business.
Fiscal 2012 Compared to Fiscal 2011
Excluding the changes in currency exchange rates, revenues for the
Emerging Markets increased 26% for fiscal 2012 as all territories in the
geography reported double-digit revenue growth, led by Argentina, Brazil,
Mexico and Korea.
For fiscal 2012, revenue growth for both footwear and apparel in the
Emerging Markets was driven by double-digit percentage growth in unit sales
and mid-single-digit percentage growth in average selling price per unit,
primarily reflective of product price increases. The overall increase in
Emerging Markets’ footwear and apparel sales was driven by strong demand
in nearly all key categories, led by Running and Sportswear.
The increase in Emerging Markets’ EBIT for fiscal 2012 was primarily the
result of revenue growth and selling and administrative expense leverage,
which more than offset a lower gross margin. Gross margin declined 150
basis points for the fiscal year, primarily due to higher product input costs,
customs duty charges and inventory obsolescence expense. These factors
were partially offset by the favorable impact of changes in standard currency
exchange rates and product price increases. Selling and administrative
expense as a percentage of revenues decreased 140 basis points, as both
demand creation expense and operating overhead grew at a slower rate than
revenues.
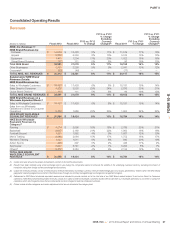
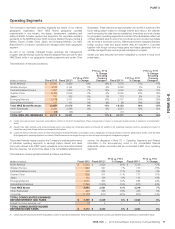
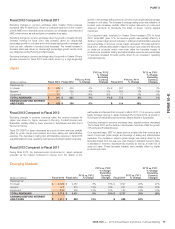
Global Brand Divisions
(Dollars in millions) Fiscal 2013 Fiscal 2012
FY13 vs. FY12
% Change
FY13 vs. FY12
% Change
Excluding
Currency
Changes Fiscal 2011
FY12 vs. FY11
% Change
FY12 vs. FY11
% Change
Excluding
Currency
Changes
Revenues $ 117 $ 111 5% 8% $ 96 16% 13%
(Loss) Before Interest and Taxes (1,396) (1,200) 16% (971) 24%
Global Brand Divisions primarily represent demand creation, operating
overhead, and product creation and design expenses that are centrally
managed for the NIKE Brand. Revenues for the Global Brand Divisions are
primarily attributable to NIKE Brand licensing businesses that are not part of a
geographic operating segment.
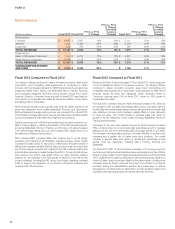
Fiscal 2013 Compared to Fiscal 2012
For fiscal 2013, Global Brand Divisions’ loss before interest and taxes
increased $196 million, primarily driven by increased investments and
marketing support for our digital business, product creation and design
initiatives and higher demand creation spending in the first quarter of fiscal
2013 around the Olympics and European Football Championships.
Fiscal 2012 Compared to Fiscal 2011
For fiscal 2012, Global Brand Divisions’ loss before interest and taxes
increased $229 million, primarily driven by increased investments in our digital
business and infrastructure for our Direct to Consumer operations, higher
sports marketing expense as well as higher personnel costs to support our
global brand functions.
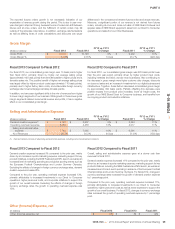
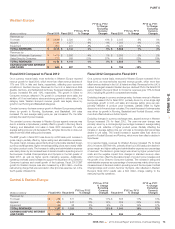
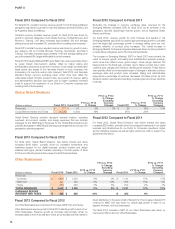
Other Businesses
(Dollars in millions) Fiscal 2013 Fiscal 2012
FY13 vs. FY12
% Change
FY13 vs. FY12
% Change
Excluding
Currency
Changes Fiscal 2011
FY12 vs. FY11
% Change
FY12 vs. FY11
% Change
Excluding
Currency
Changes
Revenues
Converse $ 1,449 $ 1,324 9% 9% $ 1,131 17% 17%
NIKE Golf 791 726 9% 10% 658 10% 9%
Hurley 260 248 5% 5% 252 -2% -1%
TOTAL REVENUES $ 2,500 $ 2,298 9% 9% $ 2,041 13% 12%
EARNINGS BEFORE
INTEREST AND TAXES $ 456 $ 385 18% $ 353 9%
Fiscal 2013 Compared to Fiscal 2012
Our Other Businesses are comprised of Converse, NIKE Golf, and Hurley.
Other Businesses revenue growth in fiscal 2013 reflects growth in each of our
Other Businesses. Revenue growth at Converse was primarily driven by
increased sales in the UK as well as in China, as we transitioned that market to
direct distribution in the second half of fiscal 2012. The increase in fiscal 2013
revenue for NIKE Golf was driven by double-digit growth in each of our
apparel, footwear, and club businesses.
The fiscal 2013 increase in EBIT for our Other Businesses was driven by
improved profits for all of our Other Businesses.
76