Nike 2013 Annual Report Download - page 47
Download and view the complete annual report
Please find page 47 of the 2013 Nike annual report below. You can navigate through the pages in the report by either clicking on the pages listed below, or by using the keyword search tool below to find specific information within the annual report.-
 1
1 -
2
-
3
-
4
-
5
-
6
-
7
-
8
-
9
-
10
-
11
-
12
-
13
-
14
-
15
-
16
-
17
-
18
-
19
-
20
-
21
-
22
-
23
-
24
-
25
-
26
-
27
-
28
-
29
-
30
-
31
-
32
-
33
-
34
-
35
-
36
-
 37
37 -
 38
38 -
 39
39 -
 40
40 -
 41
41 -
 42
42 -
 43
43 -
 44
44 -
 45
45 -
 46
46 -
 47
47 -
 48
48 -
 49
49 -
 50
50 -
 51
51 -
 52
52 -
 53
53 -
 54
54 -
 55
55 -
 56
56 -
 57
57 -
58
-
59
-
60
-
61
-
62
-
63
-
64
-
65
-
66
-
67
-
68
-
69
-
70
-
71
-
72
-
73
-
74
-
75
-
76
-
77
-
78
-
79
-
80
-
81
-
82
-
83
-
84
 |
 |
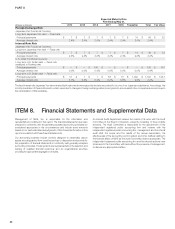
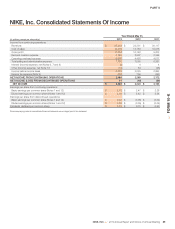
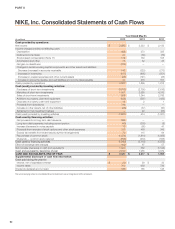
PART II
NIKE, Inc. Consolidated Statements of Cash Flows
Year Ended May 31,
(In millions) 2013 2012 2011
Cash provided by operations:
Net income $ 2,485 $ 2,223 $ 2,133
Income charges (credits) not affecting cash:
Depreciation 438 373 335
Deferred income taxes 21 (60) (76)
Stock-based compensation (Note 11) 174 130 105
Amortization and other 75 32 23
Net gain on divestitures (124) — —
Changes in certain working capital components and other assets and liabilities:
Decrease (increase) in accounts receivable 142 (323) (273)
(Increase) in inventories (197) (805) (551)
(Increase) in prepaid expenses and other current assets (28) (141) (35)
Increase in accounts payable, accrued liabilities and income taxes payable 41 470 151
Cash provided by operations 3,027 1,899 1,812
Cash (used) provided by investing activities:
Purchases of short-term investments (3,702) (2,705) (7,616)
Maturities of short-term investments 1,501 2,585 4,313
Sales of short-term investments 998 1,244 2,766
Additions to property, plant and equipment (636) (597) (432)
Disposals of property, plant and equipment 14 2 1
Proceeds from divestitures 786 — —
Increase in other assets, net of other liabilities (28) (37) (30)
Settlement of net investment hedges — 22 (23)
Cash (used) provided by investing activities (1,067) 514 (1,021)
Cash used by financing activities:
Net proceeds from long-term debt issuance 986 — —
Long-term debt payments, including current portion (49) (203) (8)
Increase (decrease) in notes payable 15 (65) 41
Proceeds from exercise of stock options and other stock issuances 313 468 345
Excess tax benefits from share-based payment arrangements 72 115 64
Repurchase of common stock (1,674) (1,814) (1,859)
Dividends — common and preferred (703) (619) (555)
Cash used by financing activities (1,040) (2,118) (1,972)
Effect of exchange rate changes 100 67 57
Net increase (decrease) in cash and equivalents 1,020 362 (1,124)
Cash and equivalents, beginning of year 2,317 1,955 3,079
CASH AND EQUIVALENTS, END OF YEAR $ 3,337 $ 2,317 $ 1,955
Supplemental disclosure of cash flow information:
Cash paid during the year for:
Interest, net of capitalized interest $ 20 $ 29 $ 32
Income taxes 702 638 736
Dividends declared and not paid 188 165 145
The accompanying notes to consolidated financial statements are an integral part of this statement.
92