Nike 2013 Annual Report Download - page 19
Download and view the complete annual report
Please find page 19 of the 2013 Nike annual report below. You can navigate through the pages in the report by either clicking on the pages listed below, or by using the keyword search tool below to find specific information within the annual report.-
 1
1 -
2
-
3
-
4
-
5
-
6
-
7
-
8
-
 9
9 -
 10
10 -
 11
11 -
 12
12 -
 13
13 -
 14
14 -
 15
15 -
 16
16 -
 17
17 -
 18
18 -
 19
19 -
 20
20 -
 21
21 -
 22
22 -
 23
23 -
 24
24 -
 25
25 -
 26
26 -
 27
27 -
 28
28 -
 29
29 -
30
-
31
-
32
-
33
-
34
-
35
-
36
-
37
-
38
-
39
-
40
-
41
-
42
-
43
-
44
-
45
-
46
-
47
-
48
-
49
-
50
-
51
-
52
-
53
-
54
-
55
-
56
-
57
-
58
-
59
-
60
-
61
-
62
-
63
-
64
-
65
-
66
-
67
-
68
-
69
-
70
-
71
-
72
-
73
-
74
-
75
-
76
-
77
-
78
-
79
-
80
-
81
-
82
-
83
-
84
 |
 |
PART II
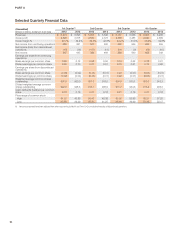
Selected Quarterly Financial Data
(Unaudited)
(Dollars in millions, except per share data)
1st Quarter(1) 2nd Quarter 3rd Quarter 4th Quarter
2013 2012 2013 2012 2013 2012 2013 2012
Revenues $ 6,474 $ 5,893 $ 5,955 $ 5,546 $ 6,187 $ 5,656 $ 6,697 $ 6,236
Gross profit 2,828 2,618 2,530 2,376 2,736 2,485 2,940 2,669
Gross margin % 43.7% 44.4% 42.5% 42.8% 44.2% 43.9% 43.9% 42.8%
Net income from continuing operations 585 661 521 480 662 569 696 559
Net income (loss) from discontinued
operations (18) (16) (137) (11) 204 (9) (28) (10)
Net income 567 645 384 469 866 560 668 549
Earnings per share from continuing
operations:
Basic earnings per common share 0.65 0.72 0.58 0.52 0.74 0.62 0.78 0.61
Diluted earnings per common share 0.63 0.70 0.57 0.51 0.73 0.61 0.76 0.60
Earnings per share from discontinued
operations:
Basic earnings per common share (0.03) (0.02) (0.15) (0.01) 0.23 (0.01) (0.03) (0.01)
Diluted earnings per common share (0.02) (0.02) (0.15) (0.01) 0.22 (0.01) (0.03) (0.01)
Weighted average common shares
outstanding 905.6 930.0 897.0 918.5 893.9 915.1 892.6 916.3
Diluted weighted average common
shares outstanding 922.8 948.6 913.1 936.9 911.7 934.6 913.4 936.3
Cash dividends declared per common
share 0.18 0.16 0.21 0.18 0.21 0.18 0.21 0.18
Price range of common stock
High 54.32 46.83 50.42 48.38 55.55 53.96 65.91 57.20
Low 43.89 39.29 45.30 41.25 48.46 46.69 53.49 52.17
(1) Amounts presented have been adjusted from what was previously filed in our Form 10-Q to exclude the results of discontinued operations.
64